How to calculate CIE 1931 color coordinates of an emission spectrum (An online application)
Автор: sci-sim
Загружено: 2022-11-27
Просмотров: 11053
Описание:
This video demonstrates how to calculate the CIE color coordinates of an emission spectrum using sci-sim online application.
The link for the online application is here
https://sciapps.sci-sim.com/CIE1931.html
Video script:
Welcome ladies and gentle men to this quick demo on how to calculate the CIE color coordinates of an emission spectrum, whether it is a photoluminescence, cathodoluminescence or electroluminescence. We will be using this online application that developed by sci-sim.
The link will be in the video description down below.
You can scroll down and read some important information about this application.
You can download one or both of these files if you would like to test this application.
Your emission spectrum data must be in a TXT or CSV format.
Without further do, lets get into it.
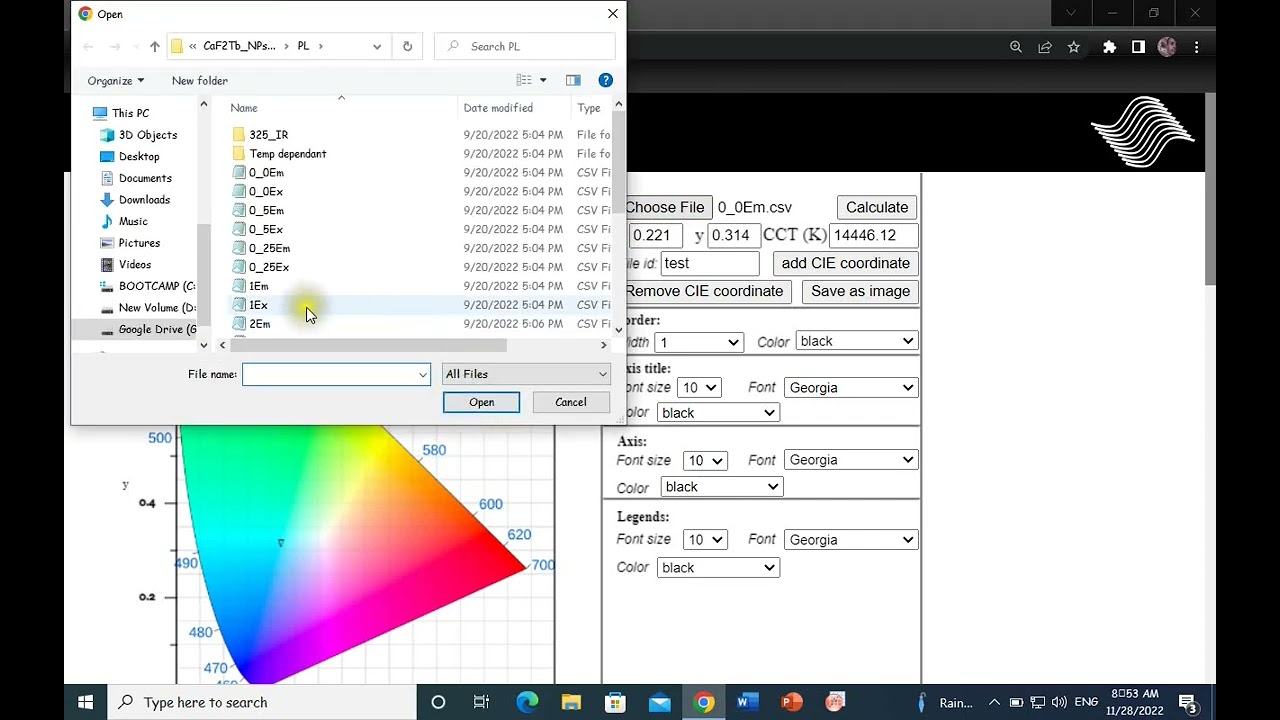
One-click on the choose file button. Navigate through your desktop. Select the emission spectrum data file. Open. You will see the file’s name displayed right next to the open file button. Click on calculate. The X and Y color coordinates were calculated as well as the color corelated temperature (CCT).
The file ID is by default the file’s name and will be displayed on the legend for each sample. However, if you wish to include a custom name you can write it here in this field instead of the file’s name. Let’s say we add a custom name for this sample “test”.
Click on add CIE coordinates and the X and Y coordinate will show on the color gamut here, as well as the sample name corresponding to this sample on the legend. Let’s add a second sample and see how it works. choose file. Select. Open. You see a new file’s name here. Click on calculate. There are new X and Y coordinates as well as CCT. Let’s say we want the custom name for this sample “test1. Click on add CIE coordinate. There it is a new X and Y coordinate on the color gamut as well as the sample’s name on the legend.
Every time you add a new sample, the symbol corresponding to the sample changes.
If you wish to change the symbol, you can simply click on remove CIE coordinate and without changing anything, click on add CIE coordinate again.
You can also style the graph. Adjust the border width and color.
Adjust the font size, style and color of the axis (this X and Y).
Once you have done with all your color coordinates and the styling, you can save the final graph as an PNG image for use in your document.
Click on save as image. And the save.
Let’s see How the actual graph look like.
You can also calculate the U and V color coordinates according to the 1976 CIE standard observer by using this application in this link.
Thank you for watching.
Повторяем попытку...
Доступные форматы для скачивания:
Скачать видео
-
Информация по загрузке: