ycliper

Популярное

Музыка Кино и Анимация Автомобили Животные Спорт Путешествия Игры Юмор

Интересные видео

2025 Сериалы Трейлеры Новости Как сделать Видеоуроки Diy своими руками

Топ запросов

смотреть а4 schoolboy runaway турецкий сериал смотреть мультфильмы эдисон
Скачать

#14 Time series data visualization in python | Analyze financial data | Matplotlib tutorial 2021

Автор: aipython

Загружено: 2020-12-25

Просмотров: 17889

Описание: 📚 Full course Link: http://bit.ly/UdemyDaViz

Video Description:
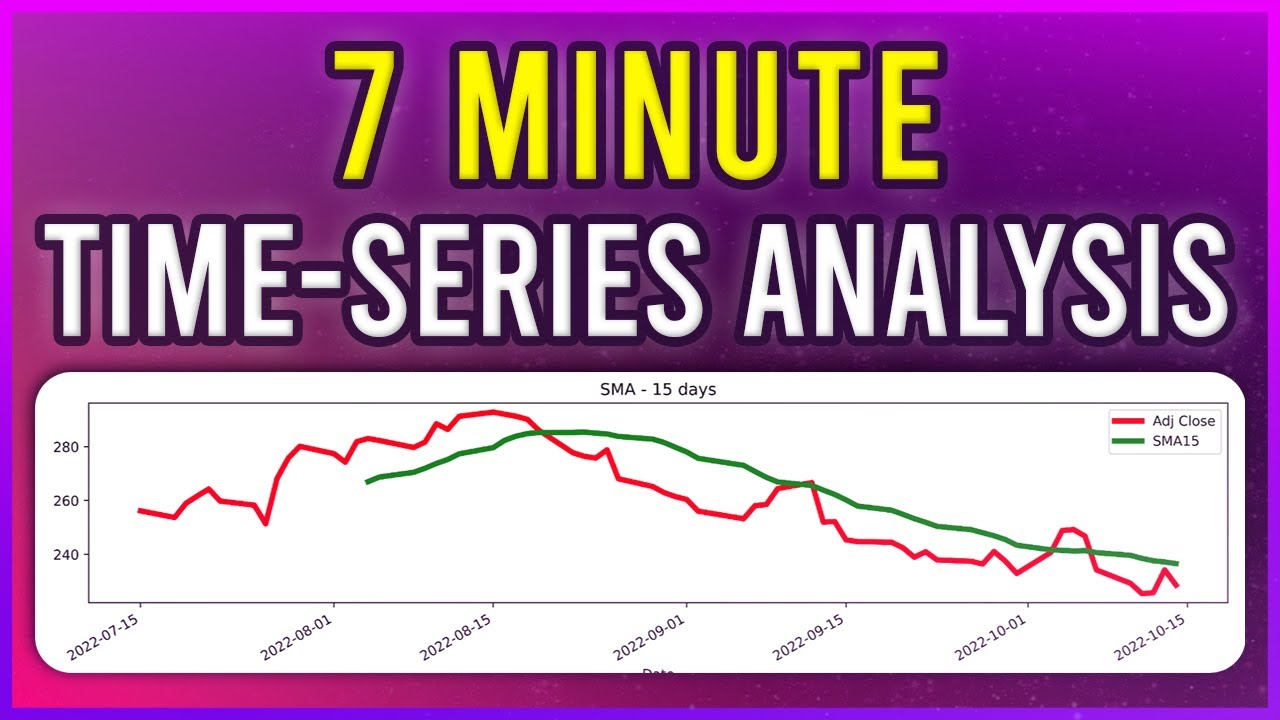
➿ In this video, you will learn how to read a CSV file with pandas, analyze data and plot on a graph using matplotlib, learn various operations such as zoom, pan and plot additional labels along with the main data.

🌐 Website: https://www.aipython.in/matplotlib for 🖺documentation and 🔡code

🔗 Useful links related to this video: https://matplotlib.org/
Learn Matplotlib: https://www.aipython.in/matplotlib-in...

🎦 Current Playlist [Matplotlib in Python] Videos
#0 Course Introduction    • #0 Course Introduction Matplotlib | Matplo...  
#1 Course Curriculum    • #1 Course Curriculum Data visualization wi...  
#2 Introduction to Matplotlib for Data visualization in Python    • #2 Introduction to Matplotlib for Data vis...  
#3 Installing Matplotlib with dependencies in Python    • #3 Installing Matplotlib with dependencies...  
#4 Getting started with Jupyter notebook    • #4 Getting started with Jupyter notebook f...  
#5 Introduction to Pyplot    • #5 Introduction to Pyplot | Matplotlib tut...  
#6 Adding labels and formatting line style    • #6 Adding labels and formatting line style...  
#7 Specify manual axis and customize markers in a plot    • #7 Specify manual axis and customize marke...  
#8 Applying Title and legends in a plot    • #8 Applying Title and legends in a plot | ...  
#9 Creating Scatter plots in Python    • #9 Creating Scatter plots in Python | Matp...  
#10 Interacting with the plot in Python    • #10 Interacting with the plot in Python | ...  
#11 Plot a Histogram in Python    • #11 Plot a Histogram in Python | Matplotli...  
#12 Plot a Pie chart in Python    • #12 Plot a Pie chart in Python | Matplotli...  
#13 Polar plot in Python    • #13 Polar plot in Python | Non-linear plot...  
#14 Time series visualization python    • #14 Time series data visualization in pyth...  
#15 Saving matplotlib plot as pdf or png    • #15 Saving matplotlib plot as pdf or png |...  

🎦 aipython's Playlist link
Python Tutorial for Beginners: https://bit.ly/3bAubXP
Python Tips & Tricks: https://bit.ly/2JpVND4
Python Projects: https://bit.ly/2UHAbY1
Matplotlib in Python: https://bit.ly/ai-matplotlib

🤝 Connect and follow us @
Website: https://www.aipython.in
Facebook (Page) :   / aipythonindia  
Facebook (Group):   / aipython  
Instagram:   / aipython_india  
Twitter:   / aipython_india  
LinkedIn :   / aipythonindia  

#aipython #timeseries #matplotlib

Не удается загрузить Youtube-плеер. Проверьте блокировку Youtube в вашей сети.
Повторяем попытку...
#14 Time series data visualization in python | Analyze financial data | Matplotlib tutorial 2021

Поделиться в:

Доступные форматы для скачивания:

Скачать видео

  • Информация по загрузке:

Скачать аудио

Похожие видео

#15 Saving matplotlib plot as pdf or png | Matplotlib tutorial 2021

#15 Saving matplotlib plot as pdf or png | Matplotlib tutorial 2021

Time Series Forecasting in Python – Tutorial for Beginners

Time Series Forecasting in Python – Tutorial for Beginners

Create Time Series Animations in Python with Matplotlib! (Bar Chart Race)

Create Time Series Animations in Python with Matplotlib! (Bar Chart Race)

7 библиотек визуализации данных Python за 15 минут

7 библиотек визуализации данных Python за 15 минут

Create Time Series Animations in Python with Matplotlib! (Line Graphs)

Create Time Series Animations in Python with Matplotlib! (Line Graphs)

Исследовательский анализ данных с помощью Pandas Python

Исследовательский анализ данных с помощью Pandas Python

Statistical Analysis of Temperature Data | Time Series Analysis in Python | Weather Derivatives

Statistical Analysis of Temperature Data | Time Series Analysis in Python | Weather Derivatives

Polars and Time Series: what it can do, and how to overcome any limitation

Polars and Time Series: what it can do, and how to overcome any limitation

Matplotlib Full Python Course - Data Science Fundamentals

Matplotlib Full Python Course - Data Science Fundamentals

Этот НЕВЕРОЯТНЫЙ трюк ускорит обработку ваших данных.

Этот НЕВЕРОЯТНЫЙ трюк ускорит обработку ваших данных.

Matplotlib Crash Course

Matplotlib Crash Course

My Workflow for Building any Streamlit Dashboard Project

My Workflow for Building any Streamlit Dashboard Project

Time-Series Data Manipulation with Pandas

Time-Series Data Manipulation with Pandas

How to Create a Beautiful Python Visualization Dashboard With Panel/Hvplot

How to Create a Beautiful Python Visualization Dashboard With Panel/Hvplot

Создайте веб-приложение для прогнозирования акций на Python

Создайте веб-приложение для прогнозирования акций на Python

Как ВАША Свобода угрожает господству мировых элит?

Как ВАША Свобода угрожает господству мировых элит?

Арестович: Война в Иране. США еще не начинали?

Арестович: Война в Иране. США еще не начинали?

Matplotlib Animations in Python

Matplotlib Animations in Python

Intro to Data Analysis / Visualization with Python, Matplotlib and Pandas | Matplotlib Tutorial

Intro to Data Analysis / Visualization with Python, Matplotlib and Pandas | Matplotlib Tutorial

Python NumPy Tutorial for Beginners

Python NumPy Tutorial for Beginners

© 2025 ycliper. Все права защищены.


  • Контакты
  • О нас
  • Политика конфиденциальности


Контакты для правообладателей: [email protected]