ES Futures Heatmap Live Day Trading Nasdaq S&P Tickstrike Orderflow
Автор: NQ / ES HeatMap Live
Загружено: 2025-07-11
Просмотров: 259
Описание:
👉 Get your LIFETIME 80% OFF APEX Discount and $50 Resets here https://tinyurl.com/7tmmbre9 for APEX Prop Firm Eval. Account, click the link or use coupon code "XNNX8CLL"
👉 Get your 20% Off for Replikanto Trade Copier --- use the code "1MFT20" at checkout. https://flowbots.ninja/?wpam_id=46
► Join FREE Discord Group Chat: / discord
👉 TRADEIFY : 30% OFF https://tinyurl.com/5n8y2ewk Use code: "JUNE" until 03/31/25
👉 BULENOX : 83% OFF https://tinyurl.com/5hxmpuc5 Use code: "TENU7" until 05/02/25 (Selected OPT1 Evals.)
👉 DAY TRADERS : 80% OFF https://tinyurl.com/4zj6ucy5
👉 TAKE PROFIT TRADER : https://tinyurl.com/3ed74a6e
👉 Before using any discount codes for prop firms listed here, please do your own research and due diligence. Make sure you fully understand their terms, conditions, and reputation before making any commitments. Trade wisely! 🚀
👍 Social Accounts
♡ TikTok: https://www.tiktok.com/@1minutefuture...
♡ Discord Group: / discord
♡ Twitter: / 1min_futures
♡ Instagram: / 1minutefuturestrader
Bookmap Terminology
------------------------------------------------------
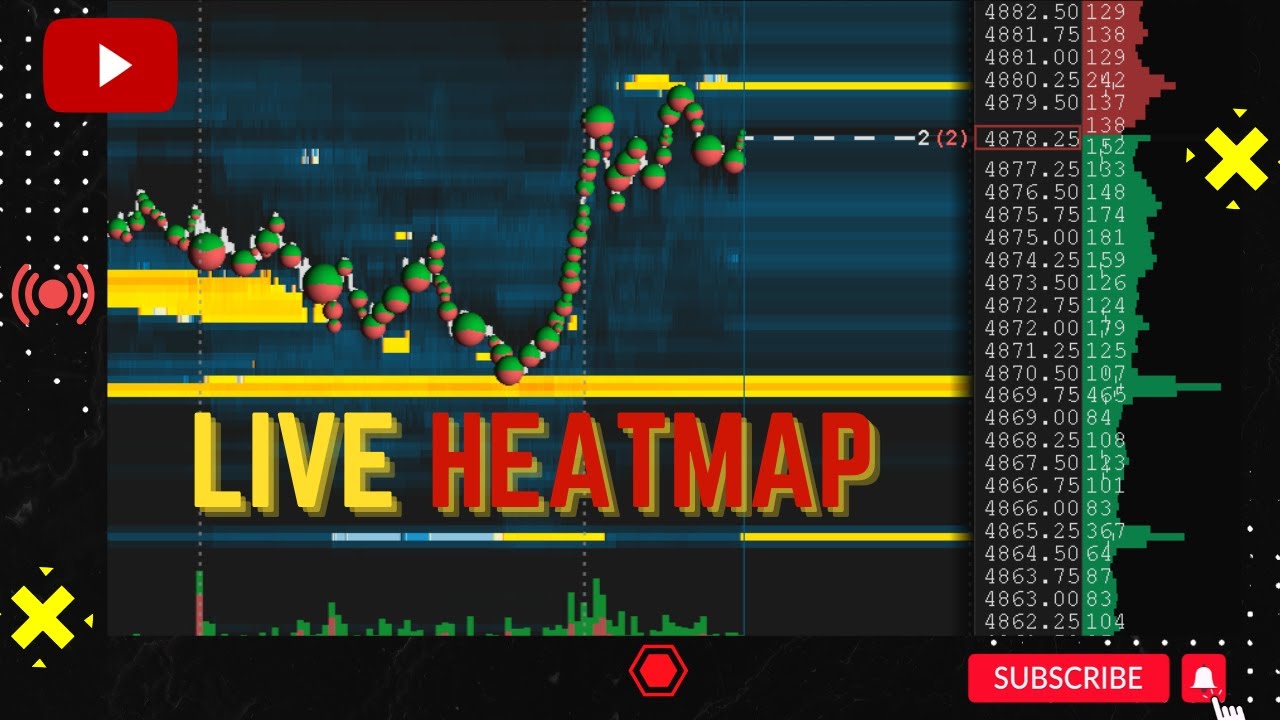
Heatmap
Heatmaps provide a visual and intuitive way to interpret order flow data, making it easier for traders to identify liquidity, patterns, trends, and potential trading opportunities.
Meaning of Colors
The warmer the yellow color, the higher the liquidity.
Colder (or bluer) colors – darker blue zones – indicate lower liquidity.
Volume dots represent the traded volume per time at a specific price. The bigger the dot, the larger the volume is. Volume bars represent the volume traded in a given timeframe.
The ticking sound
It provides real-time order flow data delivered via audio. TickStrike is a unique trading tool designed to help traders gain insight into the order flow of the market, enabling them to identify buying and selling pressure.
COB (Current Order Book)
This column displays a graphical representation and numeric values of the pending orders of the current book with bars. Users can interpret the size of pending orders by comparing the relative size of the graphical bars.
+/- (Quotes Delta)
This data represents the amount of liquidity that is either added (positive number) or pulled (negative number) from each price level.
The red rectangle depicts liquidity added or pulled at the best ask, while the green rectangle shows liquidity added or pulled at the best bid. The delta resets after each update of the best bid and ask.
CVP (Chart range volume profile)
Volume + Chart range accumulated reflects traded volume within the visible chart range.
SVP (Session Volume Profile)
The Session Volume Profile (SVP) is an indicator used in trading to analyze intraday volume activity within a specified session or sub-session.
CVD (Cumulative Volume Delta)
Cumulative Volume Delta (CVD) is a way of using Delta to measure an asset’s mid- to long-term buy and sell pressure. It compares buying and selling volume over time and offers insights into market behavior at specific price points.
T&S (Time & Sale)
Time and sales, or T&S, show volume, price, direction, date, and time data for each trade that is executed on an exchange.
VWAP (Purple line)
The volume-weighted average price (VWAP) is a trading indicator that represents the average price a security has traded at throughout the day, based on both volume and price. VWAP is calculated by totaling the dollars traded for every transaction (price multiplied by the volume) and then dividing by the total shares traded.
---------------------------------------------------------
E mini Futures scalping on 1 minute time frame using Tradovate futures trading platform, NinjaTrader 8 and Topstep, Apex and LeeLoo Prop Firms. NQ ES Nasdaq futures scalping trading strategies with Cumulative Delta and Volume Bars. Price action with 200 and 50 Moving Averages and Vwap. Live Futures Trading, Live Day Trading Futures, Live Futures Day Trading, Live Stock Trading #daytrading #livetrading #stocks #propfirm #bookmap #heatmap #orderflow #orderflowtrading
#futurestrading #schooloftrade #technicalanalysis #priceaction #tradingpatterns #invest #finance #crudeoil #Emini #Nasdaq #tradingcharts #stockmarket #financialfreedom #tradovate #ninjatrader #topstep #apextrader #LeeLoo
» DISCLAIMER « : We are not market professionals and are not liable for any losses taken in the financial markets. Everything we put out is for educational and entertainment purposes only. Always do your own research and trade responsibly! Investing of any kind involves risk. While it is possible to minimize risk, your investments are solely your responsibility. It is imperative that you conduct your own research.
AFFILIATE DISCLOSURE: Some of the links on this page are affiliate links, meaning, at no additional cost to you, I may earn a commission if you click through and make a purchase and/or subscribe.
Повторяем попытку...
Доступные форматы для скачивания:
Скачать видео
-
Информация по загрузке: