Gantt Chart in Excel MS excel Functions in Excel Data Analysis Basic Science Series
Автор: Biology Goal
Загружено: 2024-05-18
Просмотров: 160
Описание:
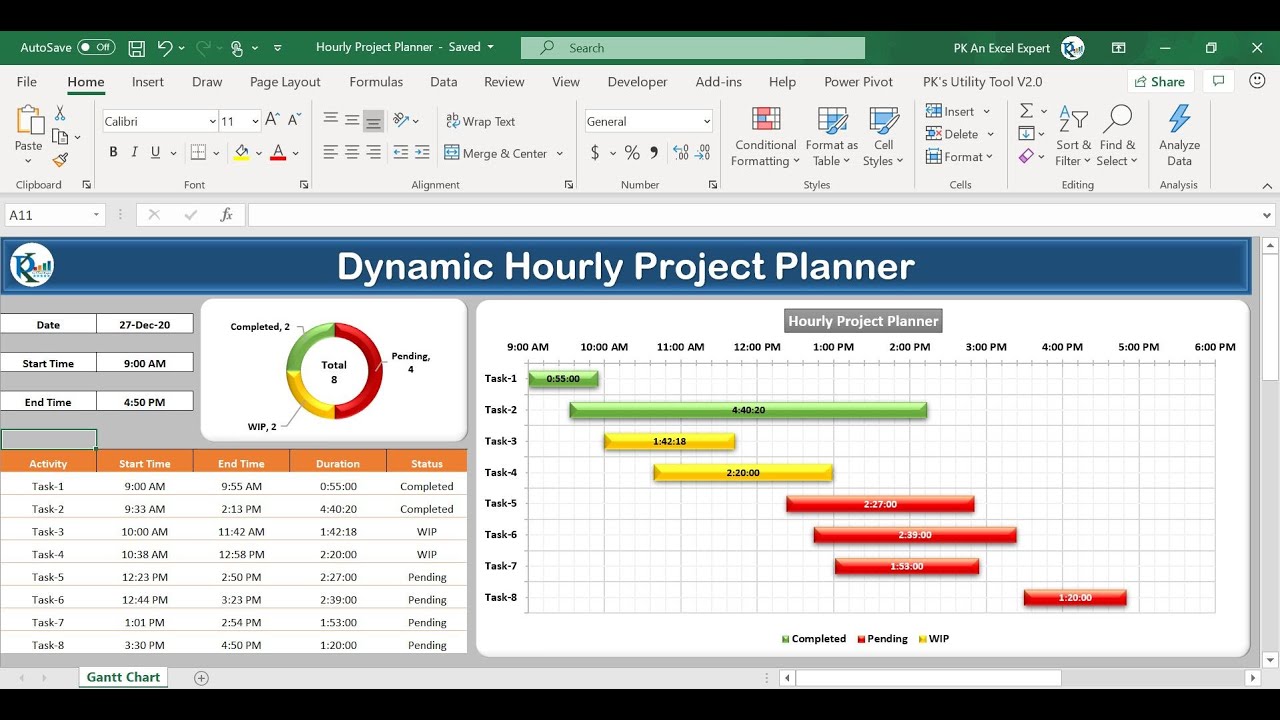
Gantt Chart in Excel MS excel Functions in Excel Data Analysis Basic Science Series
Keywords: Gantt chart in Excel, Gantt chart excel tutorial, Gantt chart excel, Gantt chart project, Gantt chart tutorial, Gantt chart power bi, Gantt chart explained, Gantt chart basics, Gantt chart for biologists, Gantt chart for project management, Gantt chart overview, Gantt chart explain nation, how to create Gantt chart in excel, how to create Gantt chart, uses of Gantt chart, best way to create Gantt charts.
1. Visual Representation 📊: Gantt charts provide a visual representation of project tasks, timelines, and dependencies. This visual clarity helps project managers and team members grasp the project's scope and progress at a glance.
2. Task Dependencies 🔄: With Gantt charts in Excel, you can easily depict task dependencies, indicating which tasks must be completed before others can start. This ensures a smooth flow of work and helps in identifying critical paths.
3. Resource Allocation 💼: Gantt charts allow for efficient resource allocation by showing when and for how long resources (such as team members or equipment) are needed. This prevents overloading or underutilizing resources, optimizing project efficiency.
4. Timeline Management ⏳: Excel Gantt charts facilitate precise timeline management by displaying start and end dates for each task. Project managers can easily track progress against deadlines, identify potential delays, and take corrective actions as needed.
5. Progress Tracking 📈: Gantt charts enable real-time progress tracking, as updates to task completion percentages or timeline adjustments can be quickly reflected. This ensures project stakeholders are always informed about the project's status.
6. Communication Tool 💬: Gantt charts serve as effective communication tools, allowing project managers to convey project plans, timelines, and progress to team members, stakeholders, and clients in a clear and concise manner.
7. Risk Management ⚠️: By visualizing task dependencies and timelines, Excel Gantt charts help identify potential risks and bottlenecks early in the project lifecycle. This allows for proactive risk mitigation strategies to be implemented, reducing the likelihood of project delays or failures.
8. Decision Making 🤔: Gantt charts aid decision-making processes by providing a comprehensive overview of the project's status, allowing project managers to make informed decisions regarding resource allocation, schedule adjustments, and prioritization of tasks.
9. Customization Flexibility 🛠️: Excel Gantt charts offer customization flexibility, allowing users to tailor the chart's appearance, add additional data fields, and incorporate custom formulas or conditional formatting to suit specific project requirements.
10. Integration with Other Tools 🔗: Gantt charts created in Excel can be easily integrated with other project management tools and software, enhancing collaboration and streamlining workflow processes across different platforms.
WhatsApp group: https://chat.whatsapp.com/HTXQC1Ax2qf...
Twitter: / basic_series
Facebook Group: / 742235929758671
LinkedIn: / basic-science-series-a54439208
Instagram: / basic_science_series
Support my work at https://www.patreon.com/user?u=37177596
Disclaimer: The information provided is for educational purposes only. The content of this channel should not be considered as medical advice of any kind. Use this information at your own risk. We hold no responsibility for any issue, concerns, or damage arising from the content of the video. Under no circumstances this channel be responsible or liable in any way for any content, including but not limited to, any errors or omissions in the content, any loss, any damage of any kind incurred as a result of any content communicated in this video, whether by this channel or a third party. In no event shall this channel be liable for any special indirect or consequential damages of any damages whatsoever resulting from the content of the channel.
Повторяем попытку...

Доступные форматы для скачивания:
Скачать видео
-
Информация по загрузке:


![🔴 EXPRESS BIEDRZYCKIEJ | KRZYSZTOF BREJZA, MEC. PRZEMYSŁAW ROSATI [NA ŻYWO]](https://imager.clipsaver.ru/RUUnqz9z7Ig/max.jpg)