How Delhi Can Cut Its Air Pollution Like Beijing Did
Автор: Earth Chakra
Загружено: 2026-02-18
Просмотров: 76
Описание:
🎙️ EARTH CHAKRA PODCAST | Can Delhi Bend It Like Beijing?
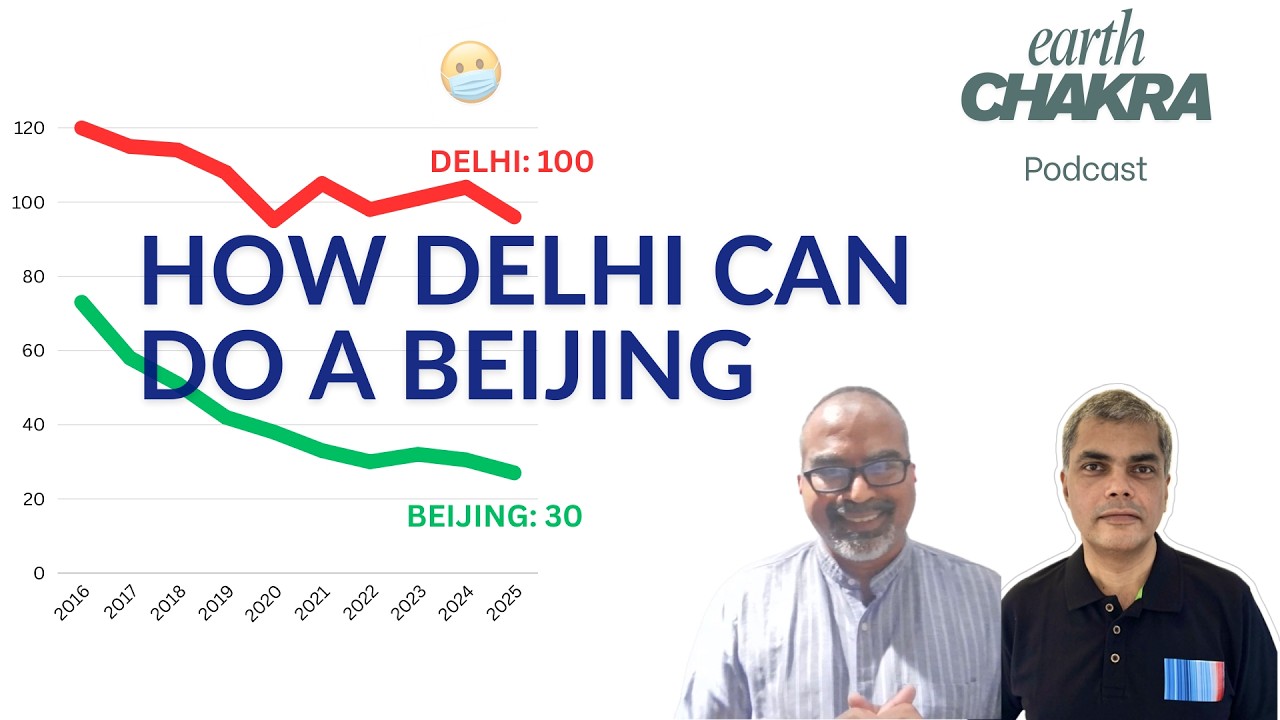
Delhi's air pollution has been stuck at 100 μg/m³ for 6 years. Beijing dropped from 80 to 30 μg/m³ in about 15 years. What's the difference? In this episode, Dr. Sarath Guttikunda (Founder, Urban Emissions) reveals the data-driven pathway that could transform Delhi's air—and he's built a tool so you can model it yourself. Speaking to the host Chetan Bhattacharji, he shows how Delhi can bend the air pollution curve like Beijing did.
🔧 TRY THE POLLUTION PATHWAY TOOL:
Download the interactive Excel tool: https://urbanemissions.info/wp-conten...
This tool models Delhi's path from 100 to 40 μg/m³ by 2040—sector by sector, intervention by intervention. Adjust sliders for vehicles, stubble burning, waste, and industry, and watch the pollution curve bend in real-time.
🎯 KEY FINDINGS FROM THE TOOL:
Eliminating stubble burning alone barely improves Delhi's air quality
Beijing dropped from 80 to 30 μg/m³ in 15 years. Delhi can too
Multi-sector approach is essential (no single solution works)
Target: 40 μg/m³ by 2040 (from current 100 μg/m³)
TOP 3 DELHI AIR POLLUTION MYTHS DEBUNKED:
1. Stubble burning is the main problem ❌
2. One sector alone can fix it ❌
3. Quick fixes will work ❌
Chapters:
00:00 Why Delhi’s PM2.5 Curve is Flat (vs. Beijing’s Success)
00:45 Modelling Clean Air: The Excel Slider Tool for Policy
01:31 PM2.5 Targets: Can Delhi hit 40 micrograms?
02:16 The Truth About Stubble Burning & Delhi Air Pollution
03:43 Reducing Vehicular Emissions: The Biggest Pollution Lever
04:49 Sector-by-Sector Recipe: Hitting National Standards by 2040
07:08 Beijing’s Playbook: Can Delhi Replicate a 15-Year Fix?
08:56 The Cost of Delay: Why 2026 is the Critical Start Date
10:03 Economic Impact of Air Pollution: Health & GDP Losses
11:51 Adapting the Tool for Other Polluted Cities in India
12:46 How Municipalities and CAQM Visualise the Path to Clean Air
13:53 Public Transport & Trucks: Achieving 50% Exhaust Cuts
14:33 Mapping CAQM’s 18 Action Plans to Pollution Sectors
15:24 User Guide: How to Model Your Own Sector Targets
16:14 Behavioural Change: Individual Responsibility in Waste Management
18:22 Two Priorities for Policy Makers: Waste & Non-Motorized Transport
20:11 Is Delhi’s Air Fixable? Realistic Targets for 2026
24:05 Final Takeaways: Funding, Political Will, and Lessons from Paris
🔬 ABOUT DR. SARATH GUTTIKUNDA:
Founder of Urban Emissions, 20+ years of air quality research, TED Fellow, creator of pollution modelling tools. https://urbanemissions.info/about-uei...
💡 WHY THIS TOOL MATTERS:
Unlike complex atmospheric models, this spreadsheet-based tool makes pollution pathways accessible to everyone—policymakers, researchers, communities, and businesses. It shows exactly which interventions work, how much they help, and what happens if we delay action.
📊 WHAT THE TOOL SHOWS:
Source apportionment by sector (transport, dust, cooking, industry, waste, stubble)
Interactive sliders to test reduction scenarios
Visual curve showing path to 40 μg/m³ target
Comparison with Beijing's successful trajectory
🎙️ ABOUT EARTH CHAKRA PODCAST:
Exploring environmental solutions, climate action, and sustainability challenges across India and the world. Hosted by Chetan Bhattacharji, a climate communications professional.
🔔 SUBSCRIBE for more conversations with scientists and changemakers tackling India's air quality and climate change problems.
📢 Questions for Dr Guttikunda or the host? Drop them in the comments!
Earth Chakra’s other handles:
X - https://x.com/Earth_Chakra
Insta - / earth.chakra.global
Writings and website:
https://chetanbhattacharji.com/
https://healthpolicy-watch.news/autho...
https://www.thehindu.com/profile/auth...
https://whatamibreathing.substack.com/
https://www.orfonline.org/contributor...
https://www.ndtv.com/search?searchtex...
https://www.newindianexpress.com/citi...
Warming Stripes logo:
Warming Stripes under Commons Licence https://showyourstripes.info/ - "The graphics have a CC-BY4.0 license, so can be used for any purpose as long as credit is given to Professor Ed Hawkins (University of Reading) and a link is provided to this website."
Credit for Warming Stripes: Professor Ed Hawkins (University of Reading)
https://creativecommons.org/licenses/...
Other sources:
Indian Express: Delhi vs Beijing https://indianexpress.com/article/exp...
Dalberg report: Cost to India’s GDP https://dalberg.com/wp-content/upload...
#DelhiPollution #AirQuality #ClimateAction #EnvironmentalScience #Beijing #StubblebBurning #VehicularPollution #CleanAir #PollutionControl #EarthChakra
Повторяем попытку...
Доступные форматы для скачивания:
Скачать видео
-
Информация по загрузке: