MCAT Exponential Decay Graphs & Semi-Log Plots | Content Review
Автор: MCAT Gold Student Hub
Загружено: 2026-01-06
Просмотров: 33
Описание:
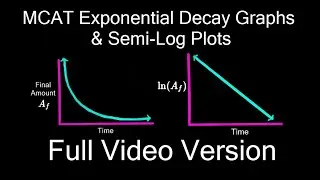
This video reviews the key concepts behind exponential decay graphs and semi-log plots, with a focus on how to interpret and analyze them in science and exam-based settings. We discuss how exponential decay appears on linear graphs, how the same data looks on a semi-log plot, and why semi-log plots produce straight lines for exponential relationships.
Throughout the video, we connect the mathematical representation to real-world and scientific examples, such as radioactive decay and population changes. The lesson emphasizes recognizing graph patterns, understanding slopes, and interpreting what graphical features mean rather than memorizing equations.
This video is intended for students reviewing exponential relationships or preparing for exams that test data interpretation and graph analysis.
Practice Problems: • MCAT Exponential Decay Graphs & Semi-Log P...
MCAT Passage Walkthrough: • MCAT Exponential Decay Graphs & Semi-Log P...
Full Video Version: • MCAT Exponential Decay + Semi-log Graphs E...
Повторяем попытку...

Доступные форматы для скачивания:
Скачать видео
-
Информация по загрузке: