Complete MTT Assay Analysis | How to Calculate IC50, % Cell Viability, Dose-response curve | Prism
Автор: LearnBytez31
Загружено: 2025-07-06
Просмотров: 6006
Описание:
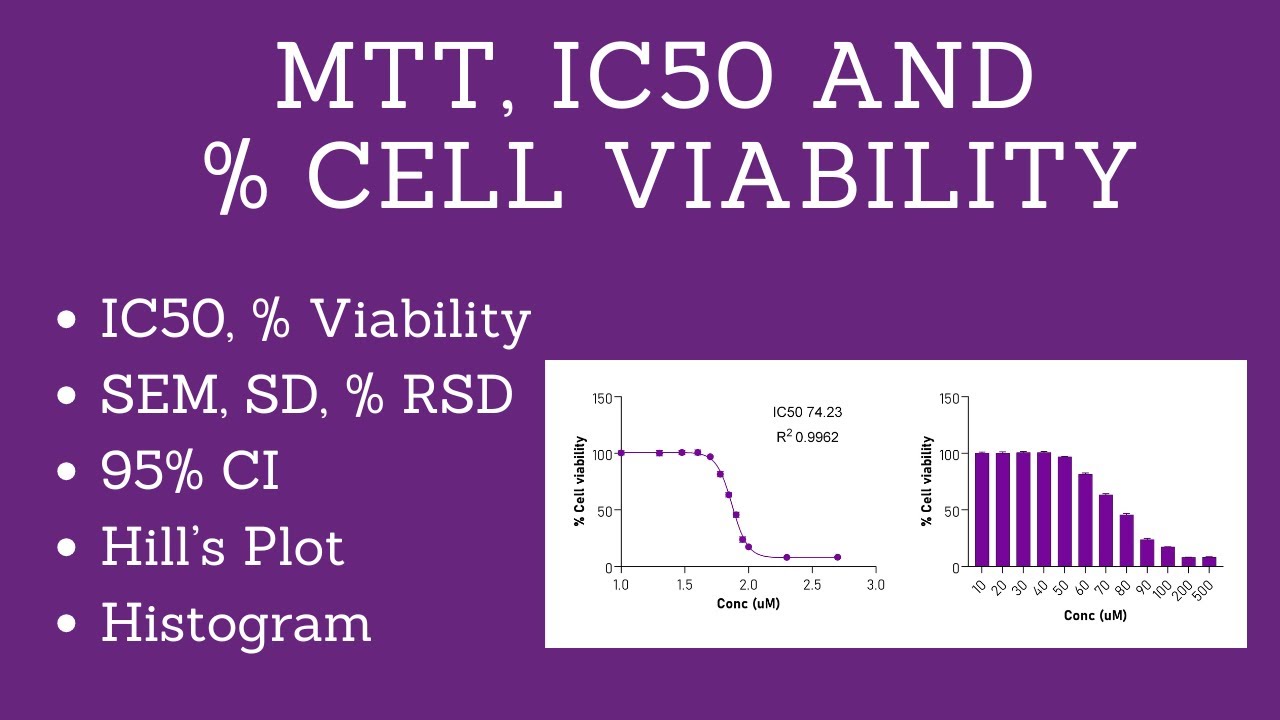
Complete MTT Assay Analysis | How to calculate IC50, % Cell Viability, Dose-response curve | GraphPad Prism
In GraphPad Prism How to calculate IC50 value, % Cell viability, How to make dose-response curve/graph, How to plot histogram and sigmoidal curve. A step-by-step complete tutorial on MTT assay analysis using GraphPad Prism and Graph representation.
🔬 In this tutorial, you will learn:
✅ How to enter and structure your data for MTT assay analysis
✅ How to process and analyze cytotoxicity data
✅ How to calculate % Cell viability, SEM, SD, %RSD, 95% confidence interval
✅ How to plot sigmoidal curve and histogram for dose-response curve
✅ Customizing and formatting graphs in GraphPad Prism
📊 Tools used:
✔ Microsoft Excel: Statistical analysis
✔ GraphPad Prism (https://www.graphpad.com/free-trial)
📚 Disclaimer:
This video is for educational and informational purposes only. Always consult appropriate references and verify your results independently. We do not guarantee the accuracy or suitability of this method for all datasets or applications. Use your own discretion and judgment when applying these techniques.
🔔 Don’t forget to subscribe for more tutorials on GraphPad Prism, MTT assays, IC₅₀ calculations, and Python-based scientific analysis.
Your Queries:
MTT assay and IC50 calculation
IC50 Calculation Using GraphPad Prism | Nonlinear Regression
How to calculate IC50 value
MTT Assay Data Analysis
How to calculate % Cell viability
Percent cell viability
How to make the dose response curve
Concentration vs Response curve
Cell viability calculation
Cytotoxicity data calculation
How to calculate standard deviation
How to calculate standard error
How to calculate standard error of mean
How to calculate 95% confidence interval
MTT assay and IC50 calculation
MTT assay analysis
MTT assay for cytotoxicity
MTT assay calculation
MTT assay for cell viability calculation
MTT assay IC50 calculation
MTT assay results interpretation
MTT assay data analysis
MTT assay graph
MTT assay experiments
MTT assay protocol for cytotoxicity
MTT assay Cell Viability and Cytotoxicity determination using MTT assay
MTT Assay for Cell Viability
How to process and analyze cytotoxicity data
#MTTAssay #IC50 #statistics #graphpadprism #histogram #dataanalysis #datavisualization #graphpadprism #cytotoxicity #nonlinearregression #PhDLife #BiomedicalResearch #Microsoftexcel #histogram #graphs #videos #analysis #calculationtrick #standarddeviation #standarderror #datascience #confidenceinterval #excel #exceltutorial #msexceltutorial
Повторяем попытку...
Доступные форматы для скачивания:
Скачать видео
-
Информация по загрузке: