Top 20 Countries by GDP (1960-2024) | Bar Chart Race
Автор: DataNeverLies
Загружено: 2026-06-07
Просмотров: 10
Описание:
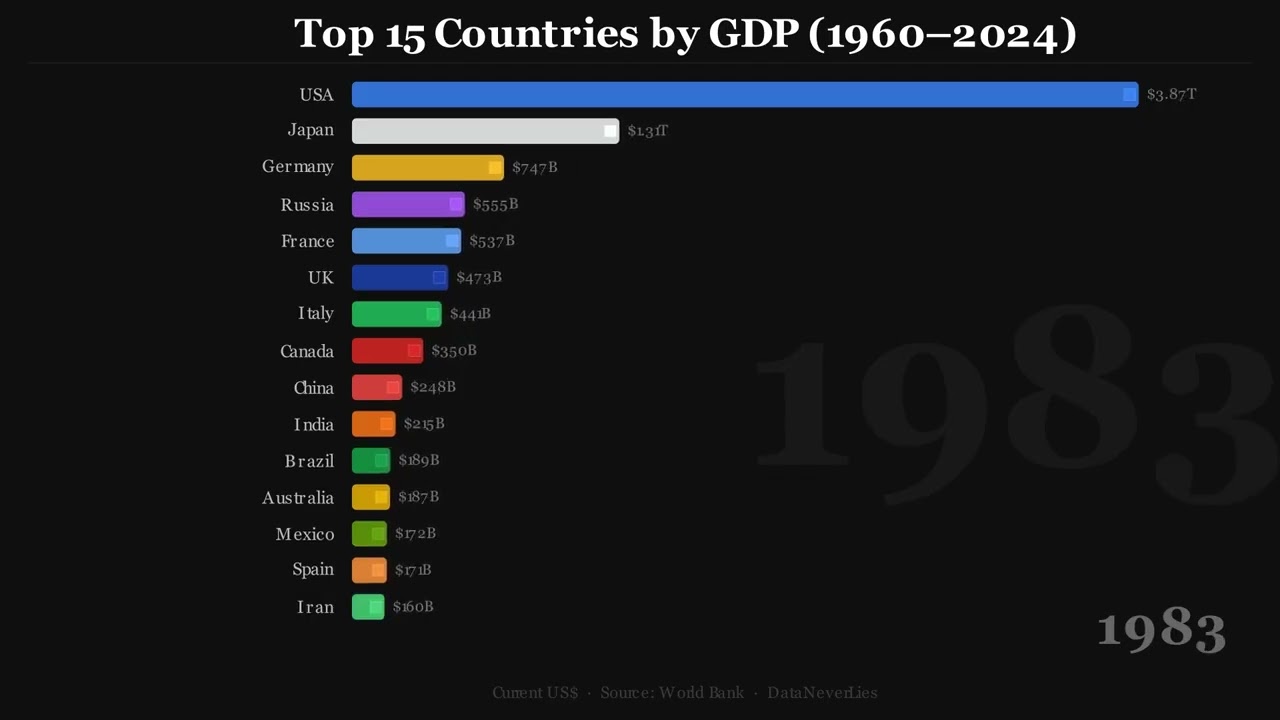
Watch 64 years of global economic history unfold in under 3 minutes. This bar chart race visualizes the GDP (current US$) of the top 20 countries from 1960 to 2024, using data from the World Bank.
Key highlights:
USA maintained the #1 position for over 50 years, reaching $28.75 trillion by 2024
China's meteoric rise from outside the top 10 to #2 in 2010, overtaking Japan
Japan peaked at 73% of US GDP in 1995, then gradually fell to #4 by 2024
India broke into the top 5 in 2022, overtaking the UK and France
Data Source: World Bank Open Data
Indicator: NY.GDP.MKTP.CD — GDP (current US$)
Visualization: Made with Manim (Python)
© Data Doesn't Lie
Subscribe for more data visualizations!
Повторяем попытку...
Доступные форматы для скачивания:
Скачать видео
-
Информация по загрузке: