How to read candlestick price movement crypto trading
Автор: Algo Trading Strategies
Загружено: 2025-05-10
Просмотров: 3604
Описание:
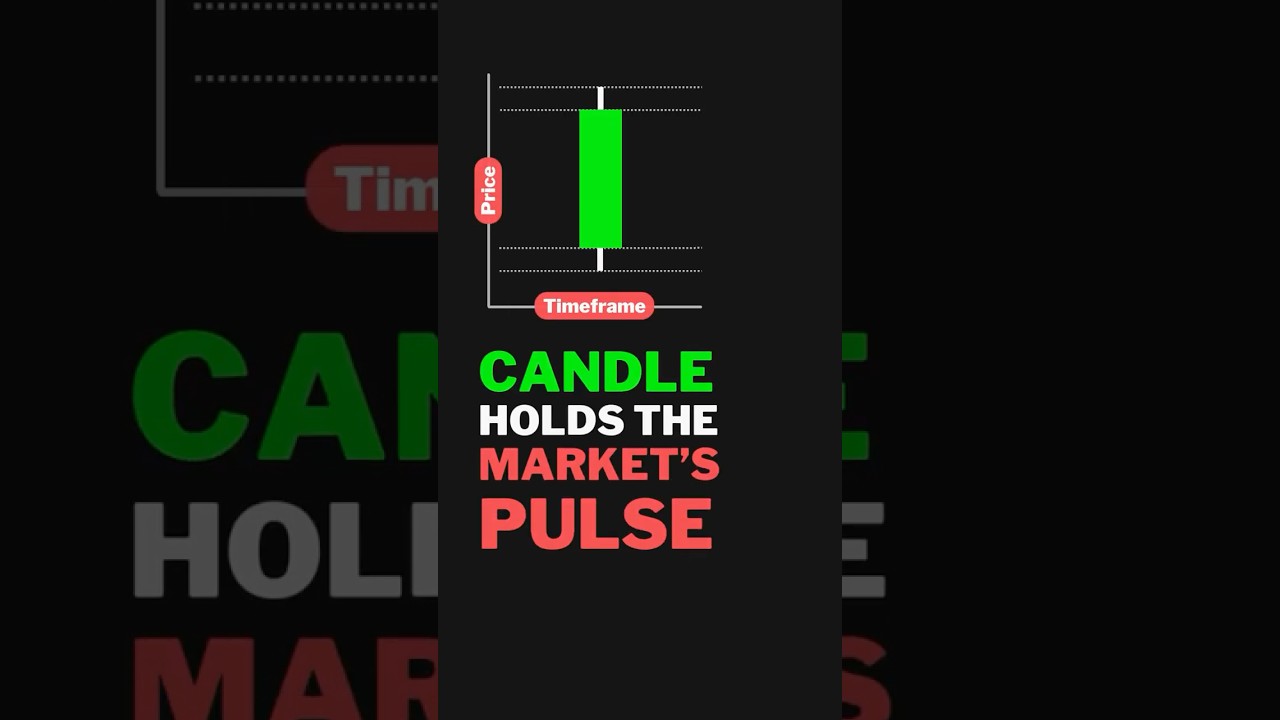
This candle holds the market’s pulse! It begins with an opening price of 10, dips to a low of 5, climbs to a high of 25, and ultimately closes at 20. Each part of this candle tells a story about market sentiment during that timeframe.
The body of the candle, which stretches from the opening price to the closing price, reflects the net movement of price over the period. In this case, the body is bullish since the closing price (20) is higher than the opening price (10), indicating that buyers gained control by the end of the session.
The wicks, or shadows, highlight the volatility and price action throughout the period. The lower wick, reaching down to 5, shows that sellers pushed the price down significantly, but buyers stepped in to drive it back up. The upper wick, extending to 25, indicates that there was strong buying pressure at one point, but sellers took over before the close, preventing the price from holding those gains.
Повторяем попытку...
Доступные форматы для скачивания:
Скачать видео
-
Информация по загрузке:


