XTZ Technical Analysis — Breakout Above Bollinger Band Upper With 2.3x Volume | CIL Signal AI
Автор: CIL SIGNAL AI
Загружено: 2026-07-23
Просмотров: 2
Описание:
XTZ Technical Analysis — Breakout Above Bollinger Band Upper With 2.3x Volume | CIL Signal AI
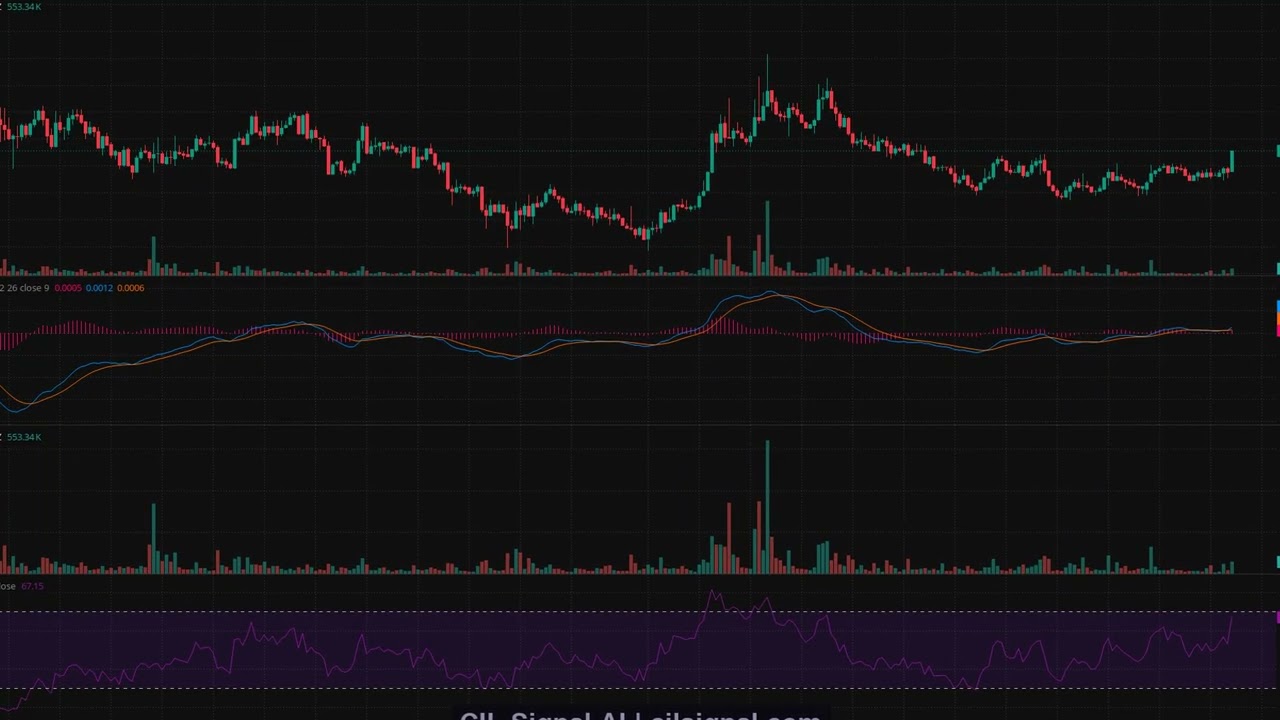
XTZ/USDT is currently trading at $0.2352 on the 4-hour timeframe, and the setup is worth breaking down in detail.
Price has pushed above the Bollinger Band upper at $0.2323. On its own, that's a stat. Combined with 2.3x above-average volume, it becomes a signal. Volume-backed BB upper breaks tend to have more follow-through than those on thin participation.
Let's look at the moving averages. EMA20 is at $0.2276 and EMA50 is at $0.2273 — both rising, both closely aligned. This tight EMA stack below price is a textbook bullish structure on the 4H chart. It tells us momentum has been consistent, not sudden.
RSI is printing 61.6. That's in bullish territory with room to run before hitting the overbought zone above 70. MACD histogram is at +0.0005 — thin, but positive and supporting the directional bias.
Key price levels to monitor:
→ $0.2323 — BB upper, now critical near-term support
→ $0.2276 — EMA20, first line of defense on any pullback
→ $0.2234 — BB lower, stronger support if the move reverses
→ $0.24 zone — next logical resistance target if buyers hold control
The bull case stays intact while price holds above $0.2323 with volume staying above average. A drop back below that level on fading volume would shift the picture toward a false breakout scenario.
This is XTZ/USDT 4-hour analysis from CIL Signal AI. Not financial advice. Always do your own research.
cilsignal.com
Повторяем попытку...
Доступные форматы для скачивания:
Скачать видео
-
Информация по загрузке: