Report in 90 seconds by Power BI
Автор: AIデータ活用パートナー
Загружено: 2026-01-04
Просмотров: 0
Описание:
#powerbi #shorts #shorts #powerbi
===
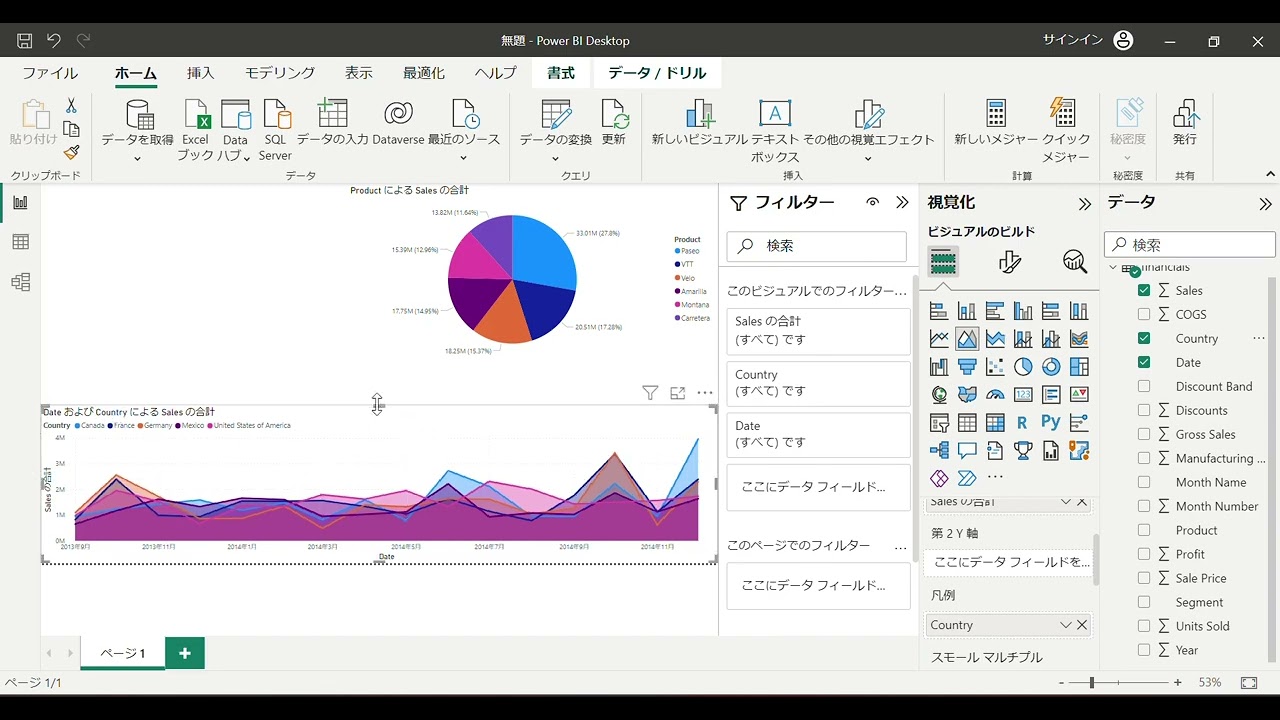
The video is a tutorial demonstrating how to create a report in Power BI in 90 seconds. It covers the following steps:
Creating a Pie Chart: The video begins by showing the Power BI interface and then guides on creating a pie chart by selecting the visual and dragging "Sales" and "Product" to it [00:00, 00:05].
Changing Chart Type to Area Chart: It then shows how to change the pie chart to an area chart [00:21].
Adding Data to Area Chart: For the area chart, "Date" is added to the X-axis and "Country" to the "Small Multiples" field [00:30, 00:39].
Adding Card Visuals: Two card visuals are added to display total sales and total COGS (Cost of Goods Sold) [00:55, 01:16].
Interactivity Demonstration: Finally, the tutorial illustrates how selecting a segment of the pie chart updates the sales and COGS figures in the card visuals for the chosen product [01:20].
Report Conclusion: The video ends by showing the updated report with the selected product's data [01:39].
Повторяем попытку...
Доступные форматы для скачивания:
Скачать видео
-
Информация по загрузке:


