How to Use Price-to-Free-Cash-Flow (P/FCF) to Find Undervalued Stocks. Guide to Unlock Profits.
Автор: Financial Discussion
Загружено: 2026-01-19
Просмотров: 211
Описание:
Watch these videos to decide which stock to buy:
• Types of Stocks: Value (Dividend Income) V...
Unlock Profits with Price-to-Free-Cash-Flow (P/FCF): Step-by-Step Guide to Find Undervalued Stocks.
Price-to-Free-Cash-Flow (P/FCF)
Definition:
Price-to-Free-Cash-Flow (P/FCF) is a valuation metric that compares a company's market capitalization (or share price) to its free cash flow. It measures how much investors are paying for each dollar of free cash flow a company generates.
"𝐏𝐫𝐢𝐜𝐞−𝐭𝐨−𝐅𝐫𝐞𝐞−𝐂𝐚𝐬𝐡−𝐅𝐥𝐨𝐰 𝐑𝐚𝐭𝐢𝐨 "= "Market Capitalization" /"Free Cash Flow"
Or on a per-share basis:
"𝐏/𝐅𝐂𝐅 "= "Share Price" /"Free Cash Flow per Share"
Market capitalization = Current share price × Total outstanding shares
Free Cash Flow (FCF) = Operating Cash Flow - Capital Expenditures (CapEx)
This is the cash that can be used to:
Pay dividends
Buy back shares
Reduce debt
Reinvest in the business
Advantages over P/E Ratio:
Harder to Manipulate: Cash flow is more difficult to manipulate than earnings
Capital Structure Independent: Unaffected by different debt levels or tax situations
Real Cash Measurement: Focuses on actual cash available for shareholders
Investment Consideration: Accounts for maintenance/expansion costs (CapEx)
Limitations:
Volatility: FCF can be more volatile than earnings
Industry Variations: Capital-intensive businesses naturally have different FCF profiles
One-Time Items: Large CapEx or asset sales can distort single-year figures
Growth Stage: Not ideal for early-stage companies reinvesting all cash
Typical Benchmarks:
P/FCF less than 15-20: Often considered potentially undervalued
P/FCF more than 25-30: Often considered potentially overvalued
Varies by industry: Growth Vs Value, tech vs. utilities, etc.
Simple Example
Market cap: $10 billion
Free cash flow: $1 billion
"P/FCF"=10
This means investors are paying $10 for every $1 of free cash flow the company generates.
Bottom Line: P/FCF provides a cash-based perspective on valuation that complements earnings-based metrics like P/E ratio. It's particularly useful for evaluating mature, cash-generating companies and comparing firms with different accounting practices.
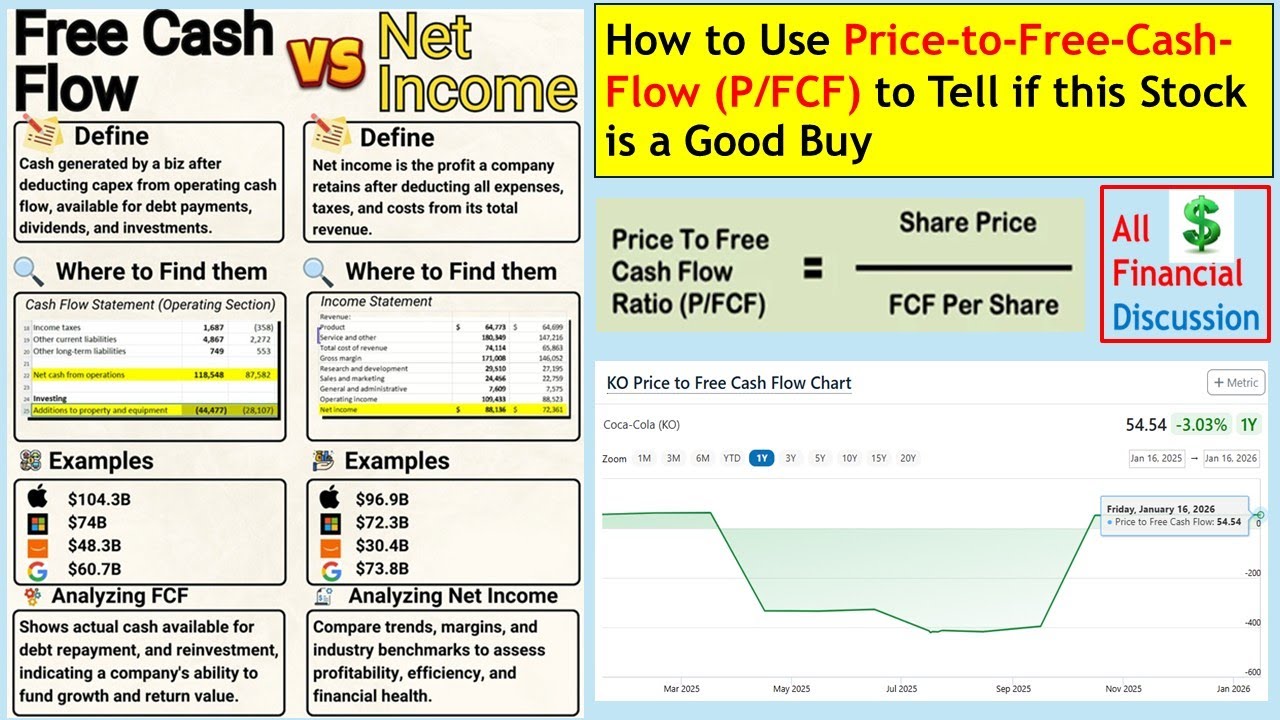
What This Means
P/FCF of ~56 means investors are paying $56 for every $1 of free cash flow generated annually.
Higher ratios indicate the stock is priced richly relative to its cash flows (common for stable, low-growth companies like KO).
It’s most useful when compared with:
Coca-Cola’s own history
Industry peers in beverages or consumer staples
Example: Industry median might be significantly lower, e.g., ~22 for non-alcoholic beverages (higher is “expensive” versus peers).
Повторяем попытку...
Доступные форматы для скачивания:
Скачать видео
-
Информация по загрузке: