ycliper

Популярное

Музыка Кино и Анимация Автомобили Животные Спорт Путешествия Игры Юмор

Интересные видео

2025 Сериалы Трейлеры Новости Как сделать Видеоуроки Diy своими руками

Топ запросов

смотреть а4 schoolboy runaway турецкий сериал смотреть мультфильмы эдисон
Скачать

Python Seaborn - 13|What is a Displot and how to create this using Seaborn in Python

Автор: Learnerea

Загружено: 2021-11-08

Просмотров: 3741

Описание: Python Seaborn - 13|What is a Displot and how to create this using Seaborn in Python|How to combine Histogram, KDE and Rug Plot into one

In this video we have covered:

00:00 - Introduction
00:05 - What is a Dis Plot
02:25 - Creating a basic Dis Plot in Python using Seaborn
02:47 - Including/Combining a KDE Plot with Histogram using Dis Plot
03:01 - Including/Combining a Rug Plot with Histogram & KDE using Dis Plot|Creating a Histogram, KDE and Rug plot altogether in one plot using Dis Plot
03:18 - Make adjustments only in Rug Plot included in a Displot
04:16 - Make adjustments only in KDE Plot included in a Displot
06:52 - Grouping a Dis Plot basis on a categorical variable
07:14 - Making Stack plot in a Dis Plot
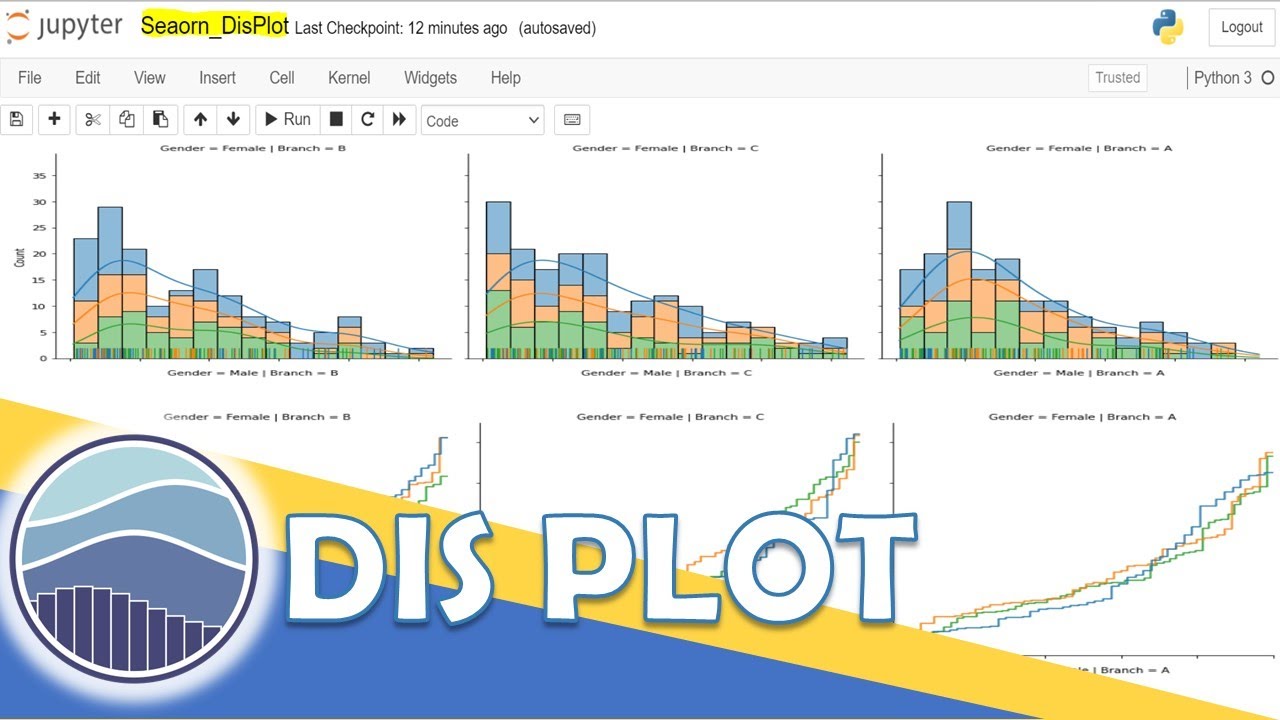
07:36 - Separating a Displot in multiple columns basis on the category in supplied categorical variable
08:37 - Separating a Displot in multiple rows basis on the category in supplied categorical variable
09:37 - Creating Bar Plots using Dis plot in Seaborn
10:22 - Creating ECDF Plot using Displot in Seaborn

Check out the KDE Plot using below link:-
   • Python Seaborn - 10|What is KDE Plot and H...  

Check out the Rug Plot using below link:-
   • Python Seaborn - 11|What is a Rug Plot in ...  

Check out the ECDF Plot using below link:-
   • Python Seaborn - 12|ECDF plot explained al...  

You can download the excel files used in this video using:
File Name : supermarket_sales.xlsx
URL : https://github.com/LEARNEREA/Python/t...

You can download the script used in the video from our GitHub page, using below details -
File Name - 13.Seaorn_DisPlot.py
URL - https://github.com/LEARNEREA/Python/t...

Seaborn official page for Displot
https://seaborn.pydata.org/generated/...

#python #pythonforbeginners #VisualizationInPython #seaborn #visualizationUsingSeaborn #DisPlotUsingSeaborn #Learnerea

Не удается загрузить Youtube-плеер. Проверьте блокировку Youtube в вашей сети.
Повторяем попытку...
Python Seaborn - 13|What is a Displot and how to create this using Seaborn in Python

Поделиться в:

Доступные форматы для скачивания:

Скачать видео

  • Информация по загрузке:

Скачать аудио

Похожие видео

Python Seaborn - 14|JOINT PLOT|Что такое JOINT PLOT и как его создать с помощью Seaborn

Python Seaborn - 14|JOINT PLOT|Что такое JOINT PLOT и как его создать с помощью Seaborn

Seaborn FacetGrid | How to make Small Multiples with Python Seaborn | Titles, Hue, Legend

Seaborn FacetGrid | How to make Small Multiples with Python Seaborn | Titles, Hue, Legend

Seaborn displot | What is the displot vs distplot? How to make a Python Seaborn distribution plot

Seaborn displot | What is the displot vs distplot? How to make a Python Seaborn distribution plot

Seaborn Beginner to Pro | Seaborn Tutorial for Beginners | Seaborn Playlist

Seaborn Beginner to Pro | Seaborn Tutorial for Beginners | Seaborn Playlist

Киев резко сменил тон / Срочное заявление Зеленского

Киев резко сменил тон / Срочное заявление Зеленского

Python Seaborn Visualization for Numeric Variables | Histogram, KDE (Kernel Density Estimate) Plot

Python Seaborn Visualization for Numeric Variables | Histogram, KDE (Kernel Density Estimate) Plot

Intro to Seaborn

Intro to Seaborn

Российский рынок ноутбуков, кто номер один. Анализ 2025-2026 годов

Российский рынок ноутбуков, кто номер один. Анализ 2025-2026 годов

✅ 16 Box plot in Python using Matplotlib  | Matplotlib tutorial 2021

✅ 16 Box plot in Python using Matplotlib | Matplotlib tutorial 2021

The Hairy Ball Theorem

The Hairy Ball Theorem

Unlocking Insights: Analyzing Machine Learning Predictions in Power BI | Data Analytics Tutorial

Unlocking Insights: Analyzing Machine Learning Predictions in Power BI | Data Analytics Tutorial

Seaborn|Visualization in Python|Complete Seaborn Tutorial|Seaborn in less than 30 minutes|Learnerea

Seaborn|Visualization in Python|Complete Seaborn Tutorial|Seaborn in less than 30 minutes|Learnerea

Seaborn Heatmap | How to Make a Heatmap in Python Seaborn and Adjust the Heatmap Style

Seaborn Heatmap | How to Make a Heatmap in Python Seaborn and Adjust the Heatmap Style

Как LLM могут хранить факты | Глава 7, Глубокое обучение

Как LLM могут хранить факты | Глава 7, Глубокое обучение

How to plot multiple sub-plots using Matplotlib and Seaborn | Session With Sumit

How to plot multiple sub-plots using Matplotlib and Seaborn | Session With Sumit

Почему работает теория шести рукопожатий? [Veritasium]

Почему работает теория шести рукопожатий? [Veritasium]

Python Seaborn Categorization Plots | How to Plot Categorical Data in Seaborn | Data Visualization

Python Seaborn Categorization Plots | How to Plot Categorical Data in Seaborn | Data Visualization

We still don't understand magnetism

We still don't understand magnetism

Data Visualization using Seaborn | Distplots

Data Visualization using Seaborn | Distplots

Самая сложная модель из тех, что мы реально понимаем

Самая сложная модель из тех, что мы реально понимаем

© 2025 ycliper. Все права защищены.


  • Контакты
  • О нас
  • Политика конфиденциальности


Контакты для правообладателей: [email protected]