Setting Breakpoints and Viewing Call Stacks in WinDbg
Автор: Hands On Course Demo
Загружено: 2026-01-18
Просмотров: 8
Описание:
Understanding the Core Problem
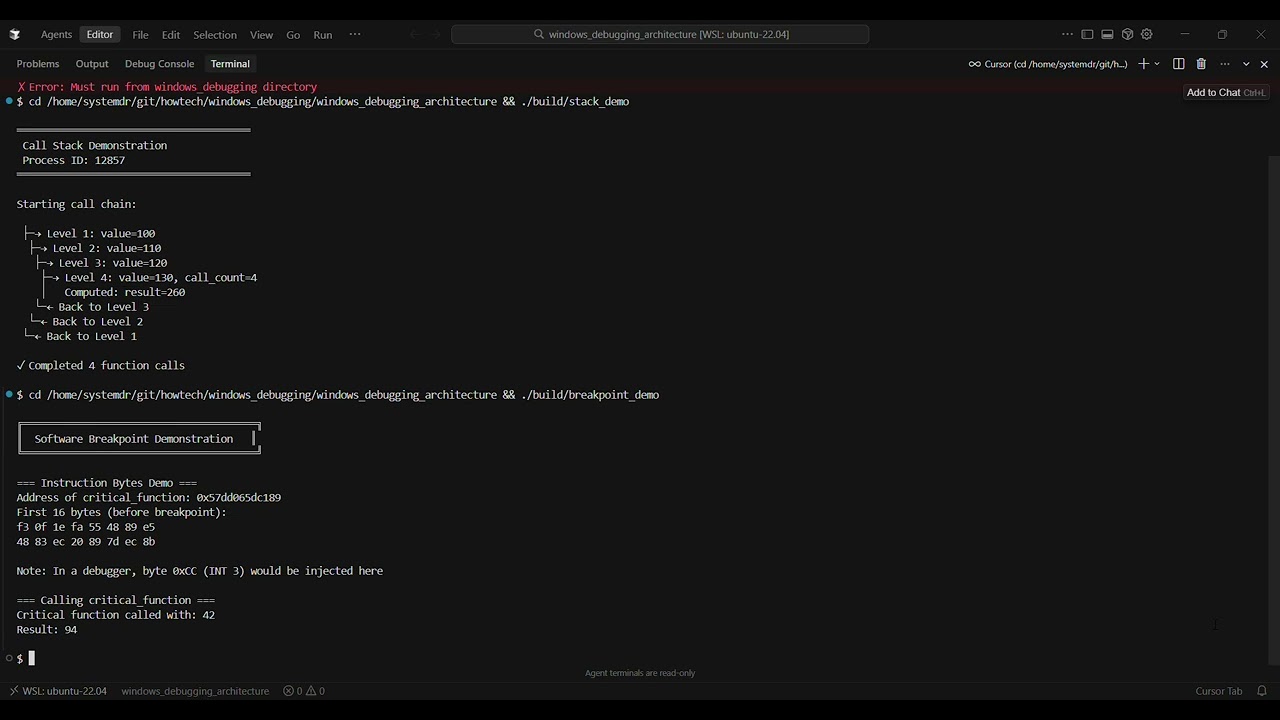
When your Windows service deadlocks at 3 AM and all you have is a crash dump, knowing WinDbg's breakpoint mechanics and stack unwinding isn't optional—it's the difference between finding the bug and guessing. Most tutorials show you bp kernel32!CreateFileW, but they don't explain why that breakpoint sometimes fires on the wrong instruction, or why your call stack shows garbage in optimized builds.
I once debugged a driver that corrupted memory only under heavy load. Setting a breakpoint on the suspected function didn't help—the corruption happened before my breakpoint hit. The problem? I used a software breakpoint (bp) which patches code with 0xCC (INT 3). In a race condition, another thread executed the half-written instruction before my breakpoint was fully set. This matters because Windows handles breakpoints fundamentally differently than POSIX debuggers.
Повторяем попытку...
Доступные форматы для скачивания:
Скачать видео
-
Информация по загрузке:


![[4K FULL HD] Relaxing Water Background | 1 HOUR | Calm Water Wallpaper (No Sound)](https://image.4k-video.ru/id-video/y9PTNTSpGJs)