Excel Analysis Without Pivot Tables | SUMIFS, COUNTIFS & Unique Values
Автор: Jopa Excel
Загружено: 2026-06-30
Просмотров: 185
Описание:
🔵FILE: https://jopaexcel.com/wp-content/uplo...
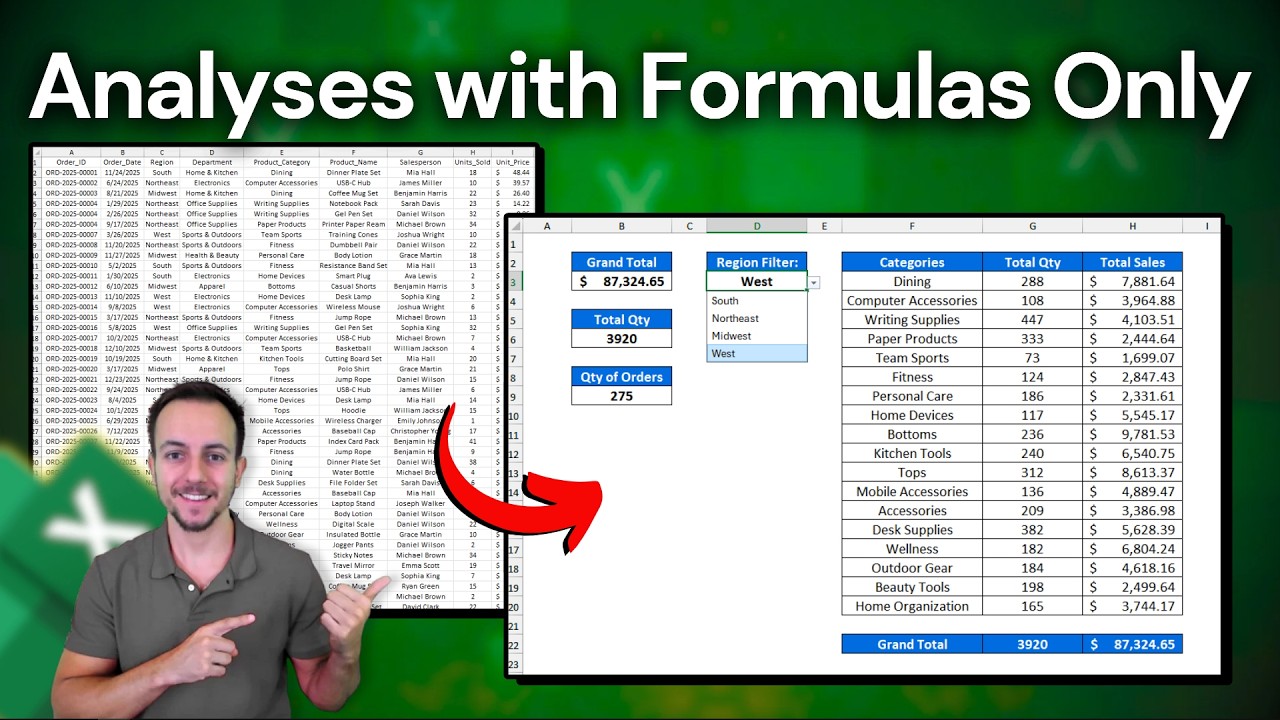
In this Excel video tutorial, we will learn how to analyze data in Excel using only formulas and functions, without creating Pivot Tables.
In this tutorial, I show you how to work with a sales report and build useful analysis using formulas like SUM, SUMIFS, and COUNTIFS. You will also learn how to copy and paste data, remove duplicates, create a unique list of values, and use that list to build drop-down menus or formula-based reports.
One of the main examples in this video is how to count unique order IDs correctly. In a sales report, the same order ID can appear in multiple rows when a customer buys more than one product in the same order. Because of that, counting all rows would give the wrong result. Instead, we need to count each order only once.
Use SUM to calculate totals, Use SUMIFS to summarize sales based on criteria, Use COUNTIFS to count records based on conditions, Remove duplicates to create a unique list, Create lists for drop-down menus, Analyze sales data without Pivot Tables, Count unique orders without counting repeated rows.
This is a great Excel tutorial for beginners and anyone who wants to improve their data analysis skills using formulas instead of Pivot Tables.
#JopaExcel #Howto #Excel
Повторяем попытку...
Доступные форматы для скачивания:
Скачать видео
-
Информация по загрузке: