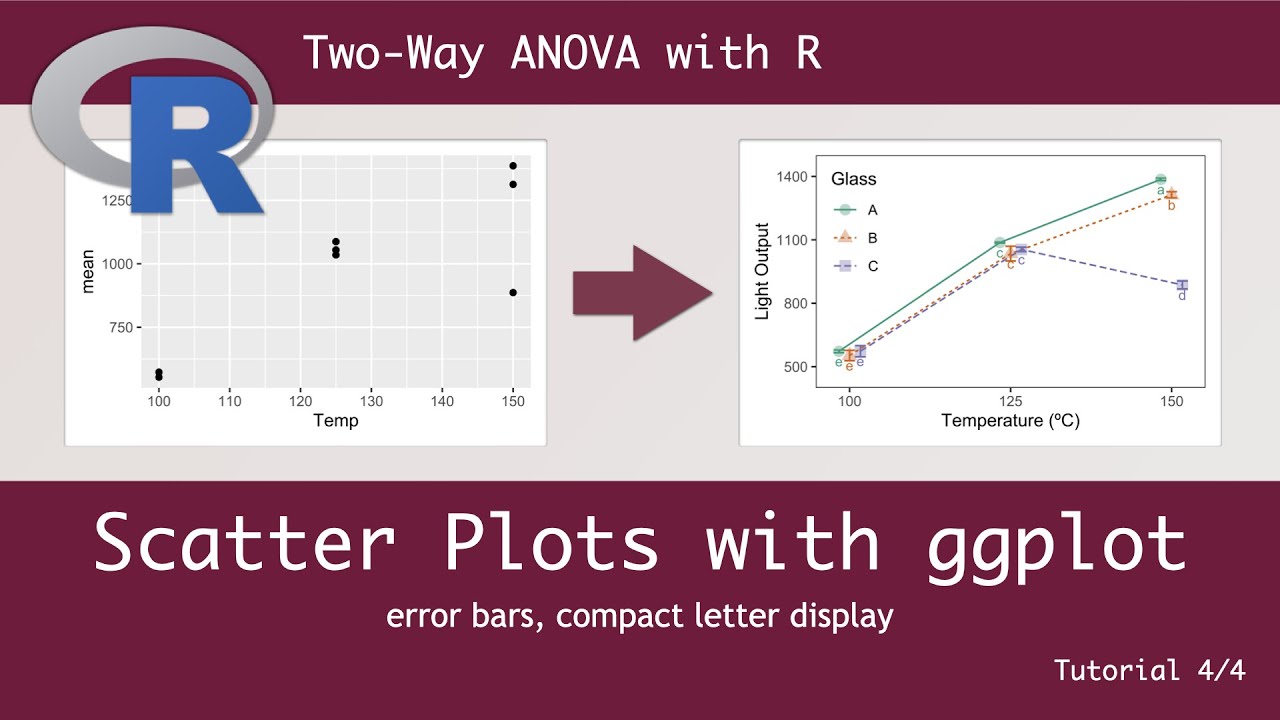
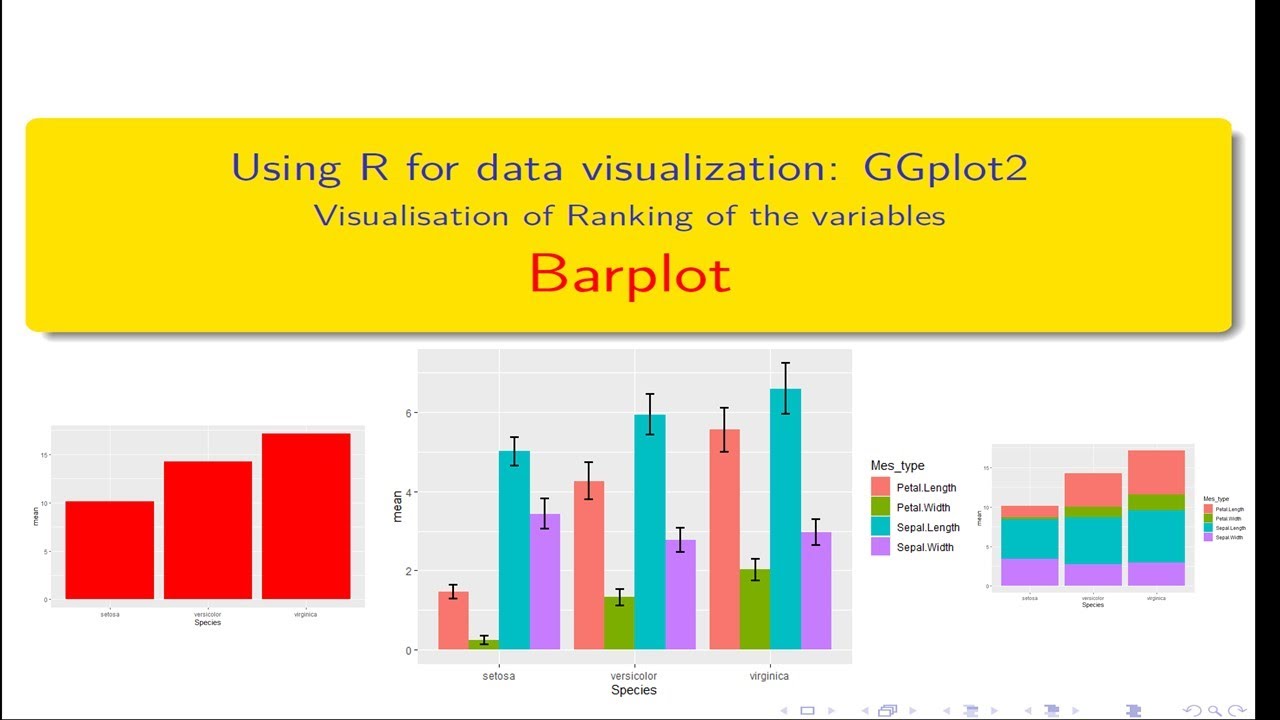
Publication-Quality Barplots for Two Factors with ggplot - Two-Way ANOVA with R - tutorial 3
Автор: StatDOE by Rosane Rech
Загружено: 2021-05-13
Просмотров: 15610
Описание:
R code: https://statdoe.com/barplot-for-two-f...
Packages: ggplot2
Main functions: ggplot, geom_bar, geom_errorbar, position_dodge, theme_bw, panel.grid.major, panel.grid.minor, element_blank, legend.position, geom_text, vjust, hjust=-0.5, show.legend, scale_fill_brewer, scale_color_brewer.
Description:
Welcome to the series of tutorials on Two-way ANOVA with R.
In this series of videos, we are going to perform a complete analysis of a two-factor factorial design.
We are going to cover the following steps :
Video tutorial 1 ( • Two-Way ANOVA with R - Analysis of Variance ):
build a simple plot for data visualisation;
perform the analysis of variance;
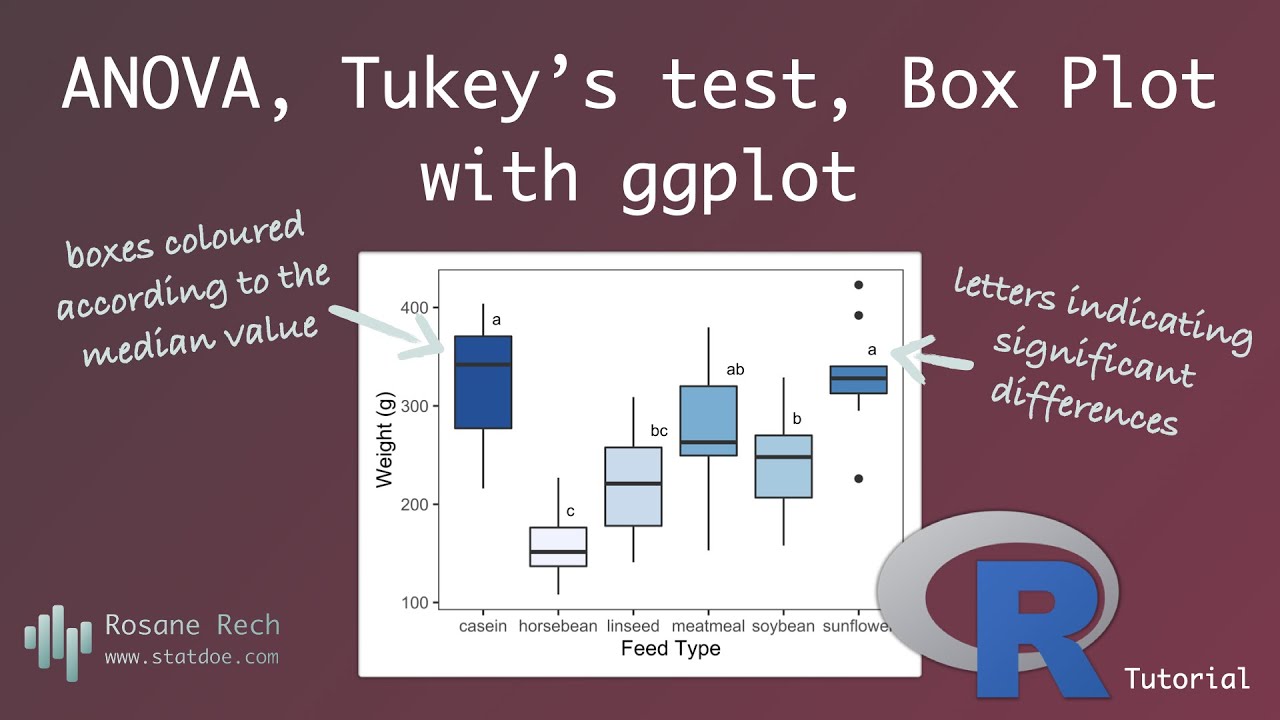
Video tutorial 2 ( • Tukey's Test and Letters to Indicate Signi... ):
create a table with the mean and standard deviation of each treatment;
compare the means by Tukey’s test;
use the compact letter display to indicate significant differences;
Video tutorial 3:
build a high-quality publication-grade bar plot,
letters indicating significant differences
grey-scale and colour-blind friendly
Video tutorial 4 ( • Publication-Quality Scatterplots for Two F... ):
build a high-quality publication-grade scatter plot. .
www.statdoe.com
Повторяем попытку...

Доступные форматы для скачивания:
Скачать видео
-
Информация по загрузке:


![Boxplots in R with ggplot and geom_boxplot() [R- Graph Gallery Tutorial]](https://imager.clipsaver.ru/Ww5kQuHtqKQ/max.jpg)