Compare Ratio Relationships | Compare Ratios Using a Table & Graph | Grade 6 📈
Автор: Luis Guillermo Valle
Загружено: 2026-03-02
Просмотров: 4
Описание:
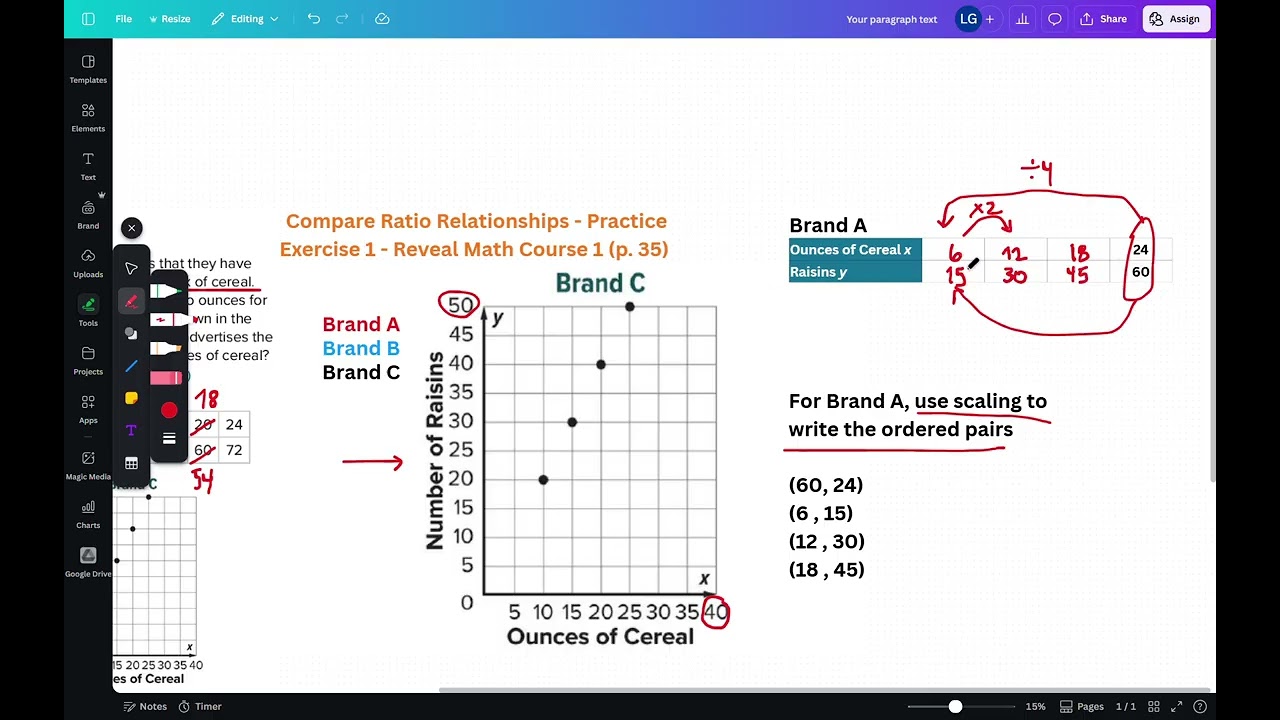
In this video, I solve a ratio comparison problem with three cereal brands (A, B, and C)—each one gives the information in a different way:
Brand A: one ratio (60 raisins in 24 ounces)
Brand B: a table (ounces ↔ raisins)
Brand C: a graph 📈
How to solve it (the method I use):
1️⃣ Brand A: scale the given ratio to write equivalent ratios and create ordered pairs (ounces, raisins).
2️⃣ Brand B: turn each row of the table into ordered pairs (and fix the table typo so the pattern stays consistent).
3️⃣ Brand C: read the ordered pairs directly from the graph.
4️⃣ Plot all three brands on the same graph, draw/compare the lines, and choose the brand with the steepest line—that brand has the greatest raisin-to-ounce ratio ✅
Try it first, then watch and compare your reasoning!
Credit / Source: This video uses a problem from Reveal Math Course 1 (McGraw Hill), Lesson Compare Ratio Relationships, Student Edition, p. 35. © McGraw Hill. Used for educational, non-commercial classroom support. All rights belong to the copyright holder.
#Ratios #EquivalentRatios #Scaling #CompareRatios #RatioRelationships #OrderedPairs #CoordinatePlane #Graphs #Math6 #SixthGradeMath #MiddleSchoolMath #RevealMath #MathLesson #ProblemSolving #ProportionalReasoning #CerealMath
Повторяем попытку...
Доступные форматы для скачивания:
Скачать видео
-
Информация по загрузке: