Pressure–Enthalpy (P–h) Chart Explained | RAC| Diploma & Polytechnic
Автор: Polytechnic Class (READBY)
Загружено: 2026-01-29
Просмотров: 2
Описание:
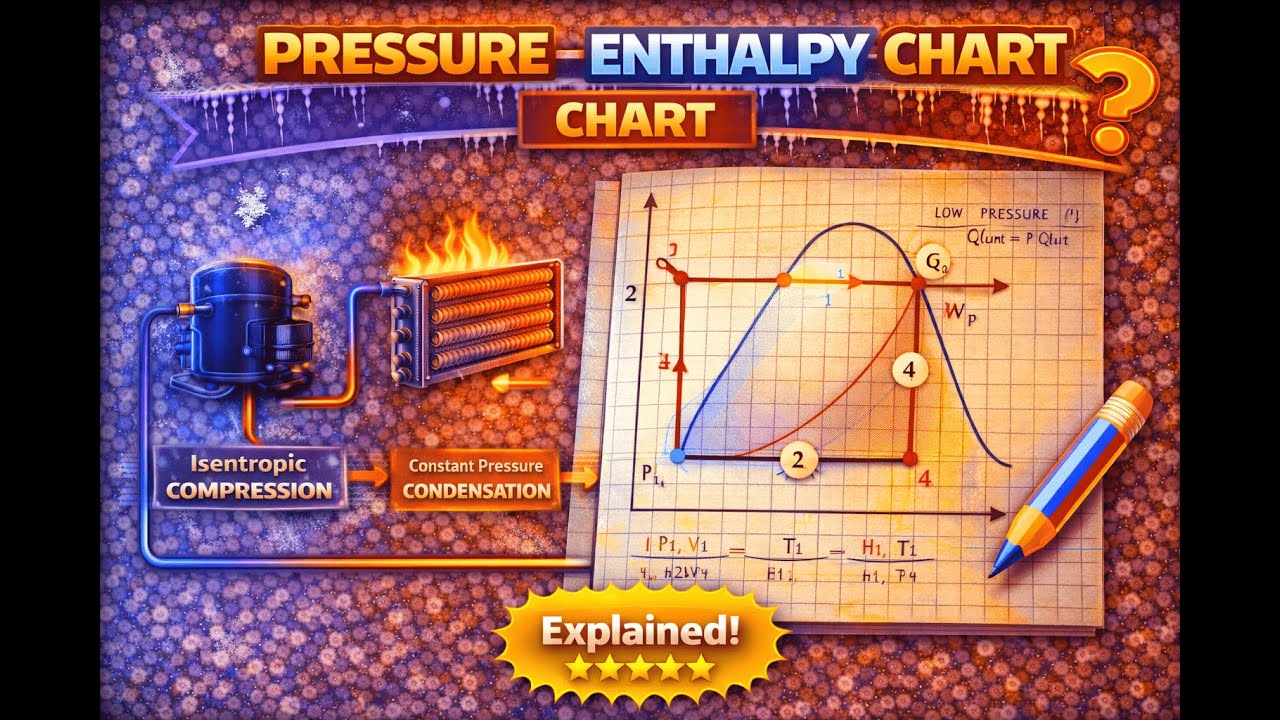
📘 Pressure–Enthalpy (P–h) Chart Explained | Refrigeration & RAC
In this video, we explain the Pressure–Enthalpy (P–h) Chart in a simple, clear, and exam-oriented manner, specially designed for Diploma and Polytechnic mechanical engineering students.
You will learn how to read and use the P–h diagram, and how it helps in analyzing the vapour compression refrigeration system.
The P–h chart is one of the most important tools in Refrigeration & Air Conditioning (RAC) and is widely used in numericals, cycle analysis, MCQs, and viva.
👨🎓 Who Should Watch This Video?
✅ Diploma Mechanical Engineering Students
✅ Polytechnic Students
✅ Students studying Refrigeration & Air Conditioning (RAC)
✅ Students solving numericals from VCR system
✅ Beginners confused about P–h diagrams
🔹 What You’ll Learn
What is Pressure–Enthalpy (P–h) Chart
Axes of P–h diagram (Pressure & Enthalpy)
Representation of vapour compression refrigeration cycle on P–h chart
Identification of processes on P–h diagram
Use of P–h chart in numericals
Advantages of using P–h chart
Important exam points
👉 Watch the full video for clear concepts and exam-ready understanding.
#PressureEnthalpy
#PHChart
#Refrigeration
#RAC
#VapourCompressionRefrigeration
#MechanicalEngineering
#DiplomaEngineering
#PolytechnicStudents
#प्रेशरएन्थैल्पी
#पीएचचार्ट
#रेफ्रिजरेशन
#आरएसी
#मैकेनिकलइंजीनियरिंग
#डिप्लोमाइंजीनियरिंग
#पॉलीटेक्निकस्टूडेंट
Повторяем попытку...
Доступные форматы для скачивания:
Скачать видео
-
Информация по загрузке: