Скачать
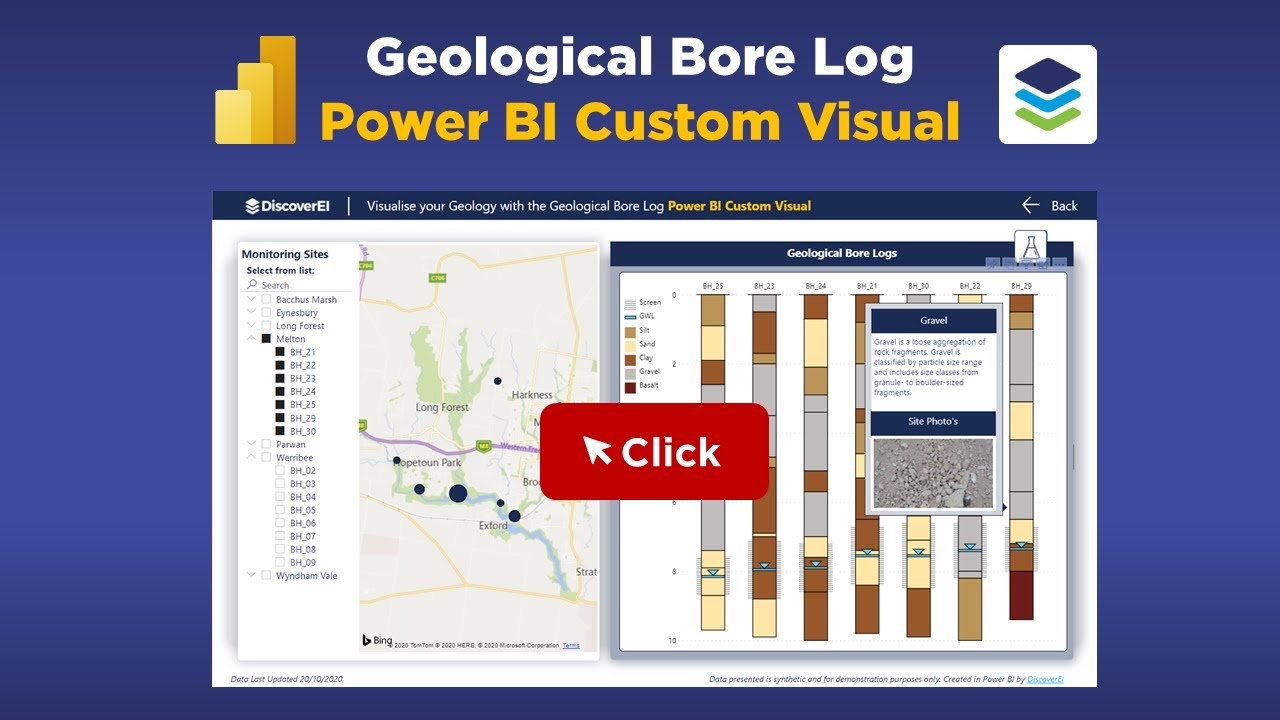
Data DiscoverEI: Power BI Visual Storytelling
Автор: DiscoverEI
Загружено: 2019-11-26
Просмотров: 924
Описание:
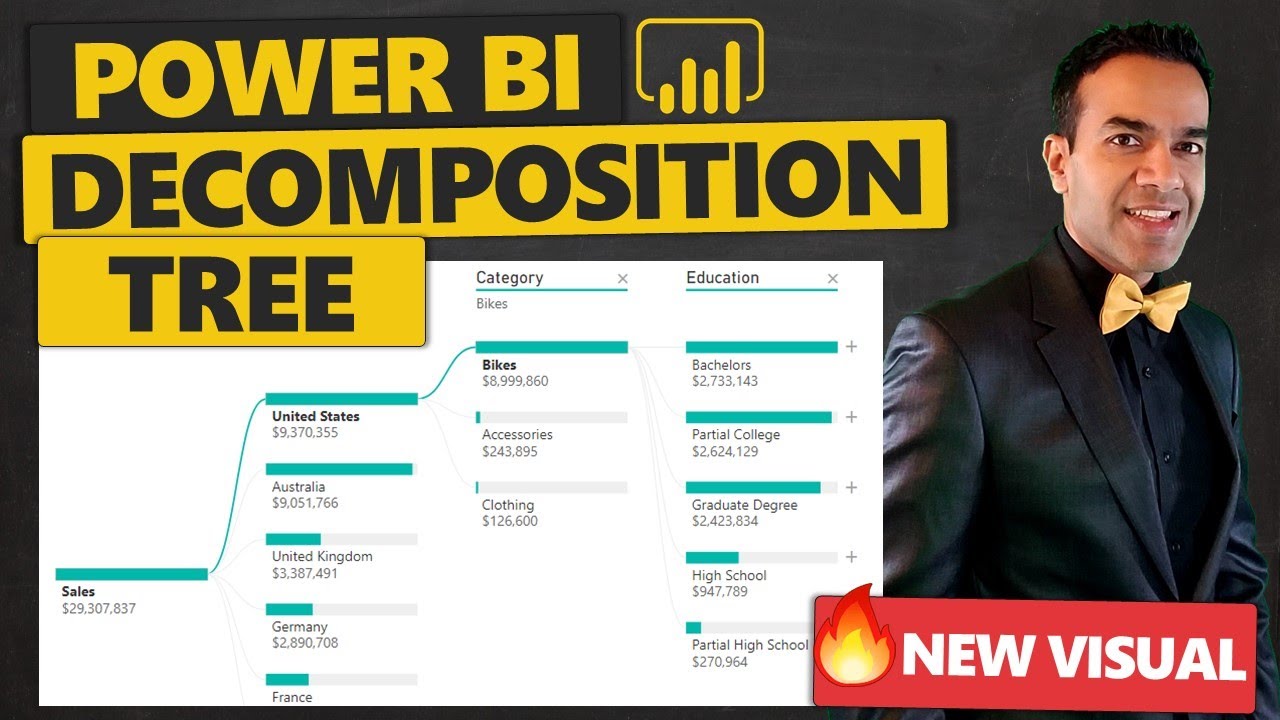
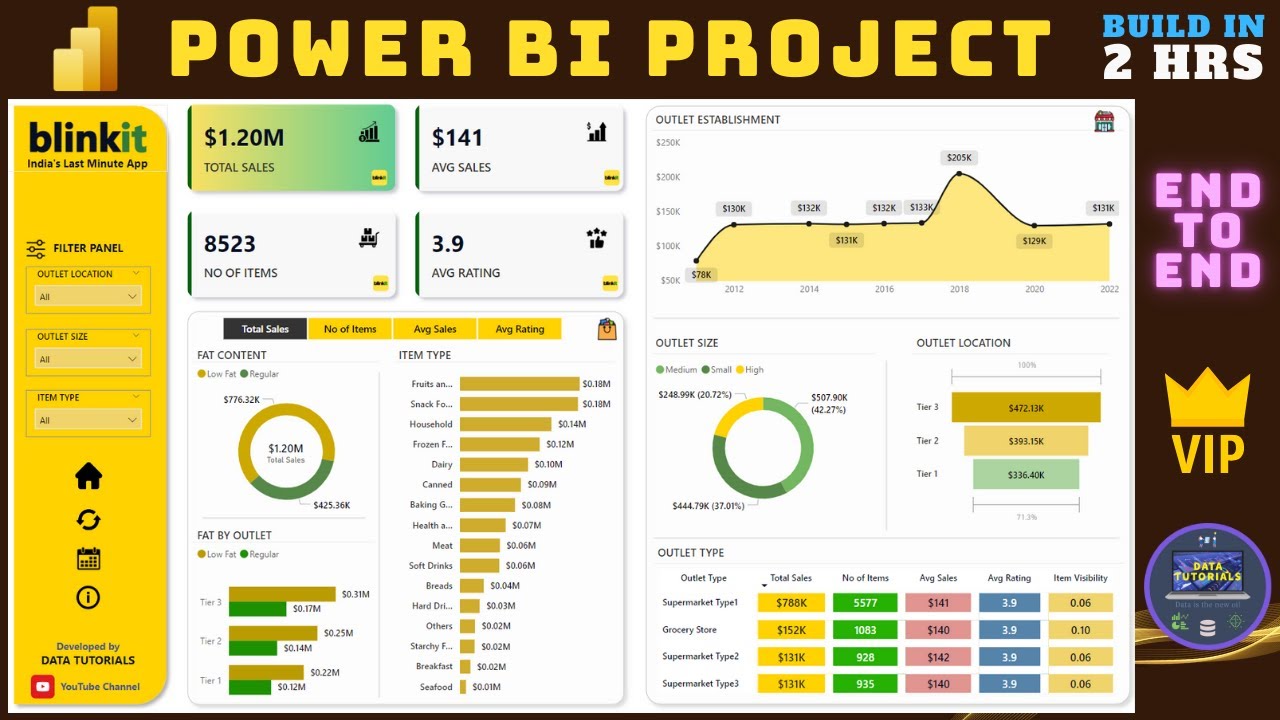
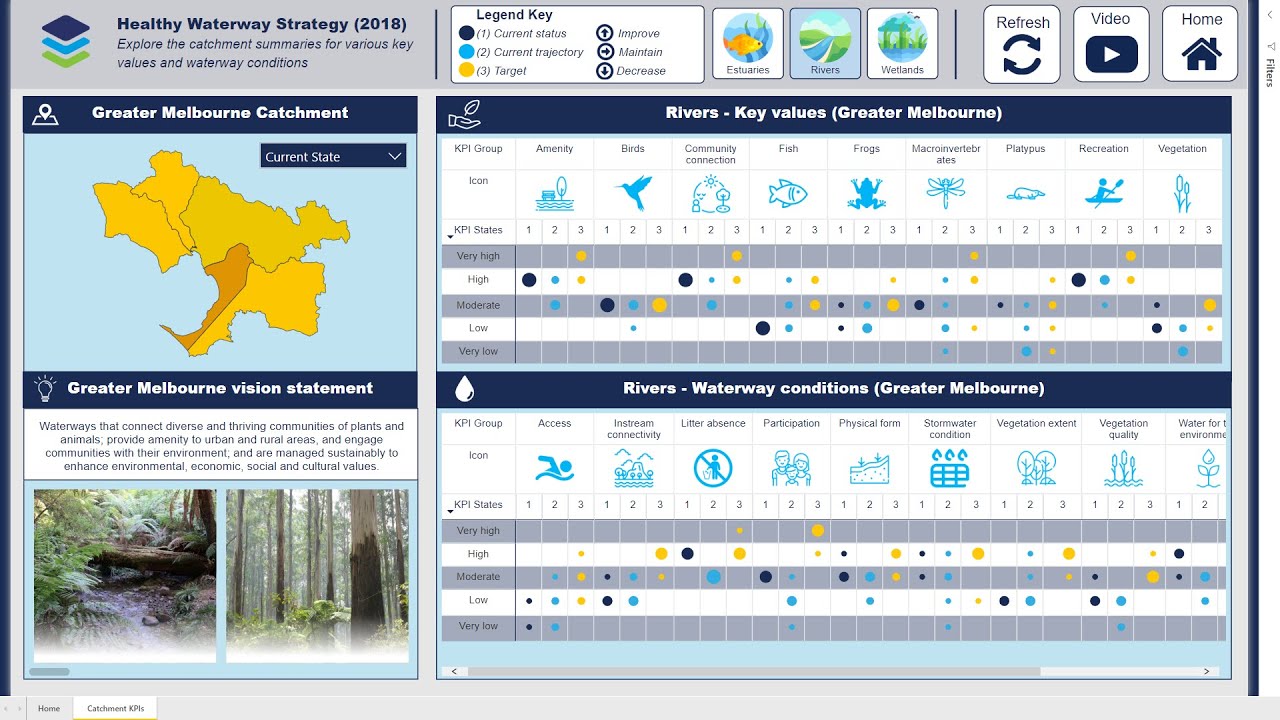
We share our favourite Power BI features for visualising environmental data, including: MapBox custom visual, report page tooltips, conditional formatting, embedding animations and embedding videos. What are your favourite features???
At DiscoverEI we love bringing environmental data to life! If you would like to find out how we can help transform your data into decisions, please get in touch with our team today: [email protected].
Не удается загрузить Youtube-плеер. Проверьте блокировку Youtube в вашей сети.
Повторяем попытку...
Повторяем попытку...
Доступные форматы для скачивания:
Скачать видео
-
Информация по загрузке: