PV और TS Diagram बनाना ही कियूं है || Why to make PV and TS Diagram
Автор: Gear Institute Mechanical Engineering Videos
Загружено: 2024-04-18
Просмотров: 15087
Описание:
For Blogs, MCQ Practice and Government Jobs Update
Visit Our Website
www.gearinstitutes.com Free Demo Course of All in 1 AE JE
For SSC JE, RRB JE, HPCL, NHPC, ISRO
Click Here for free course
https://bit.ly/4mKjwiB #sscje #mechanical #gearinstitute
Click here to download our app
https://edumartin.page.link/jLFr
Join telegram channel
https://t.me/gearinstitute
JE की तयारी के लिए App Download करें
https://edumartin.page.link/jLFr
Join our whats app channel
https://whatsapp.com/channel/0029VaCP...
ALL IN 1 AE/JE EXAM LIVE CLASSES (TECHNICAL +NON TECHNICAL)
https://bit.ly/452qVRR
ALL IN 1 AE/JE EXAM LIVE CLASSES (TECHNICAL ONLY)
https://bit.ly/3Rp4ykf
SSC JE RECORDED COURSE (2YEAR VALIDITY).
http://bit.ly/3CSOuzH
SSC JE RECORDED COURSE (1YEAR VALDITY)
http://bit.ly/3W9LVjv
Mechanical MCQ Book written by Er.Harvinder Singh
Order your copy click here
https://bit.ly/MCQBOOK
Strength of material Full Syllabus
https://bit.ly/38jyEBX
Fluid Mechanics Full Syllabus
https://bit.ly/3uNsG3z
Theory of machine Full Syllabus
https://bit.ly/3xRPQJk
Thermodynamics Full Syllabus
https://bit.ly/3k7lXws
Material Science full syllabus
https://bit.ly/38pU5Bf
Machine Design Full Syllabus
https://bit.ly/3k7lr1u
Automobile Engineering Full Syllabus
https://bit.ly/3wMMm8S
Refrigeration and air conditioning Full Syllabus
https://bit.ly/3Q2tHyy
Power plant engineering
http://bit.ly/3kGoj9v
Workshop Technology
https://bit.ly/3QGsNIo
Industrial Engineering
https://bit.ly/3vvyyjq
Pressure-volume (P-V) and temperature-entropy (T-S) diagrams are often used as teaching. aids to describe refrigeration processes in introductory textbooks. They trace the path of a. hypothetical element of gas as it moves through a system during a complete thermodynamic. cycle.
What is the full form of PV and TS?
Let us learn the processes with the help of the “Pressure-Volume (PV) Diagram” and “Temperature-Entropy (TS) Diagram”.
What is the relationship between PV and T-S diagram?
P-V and T-S Diagrams
As described on the work slide, the area under a process curve on a p-V diagram is equal to the work performed by a gas during the process. On the right of the figure we have plotted the temperature versus the entropy of the gas. This plot is called a T-s diagram.
What is PV in physics?
Pressure volume diagram - Energy Education
The PV diagram models the relationship between pressure (P) and volume (V) for an ideal gas. An ideal gas is one that never condenses regardless of the various changes its state variables (pressure, volume, temperature) undergo.
What is PV full form?
Photovoltaic (PV) materials and devices convert sunlight into electrical energy. Department of Energy
What is the difference between PV diagram and T-S diagram?
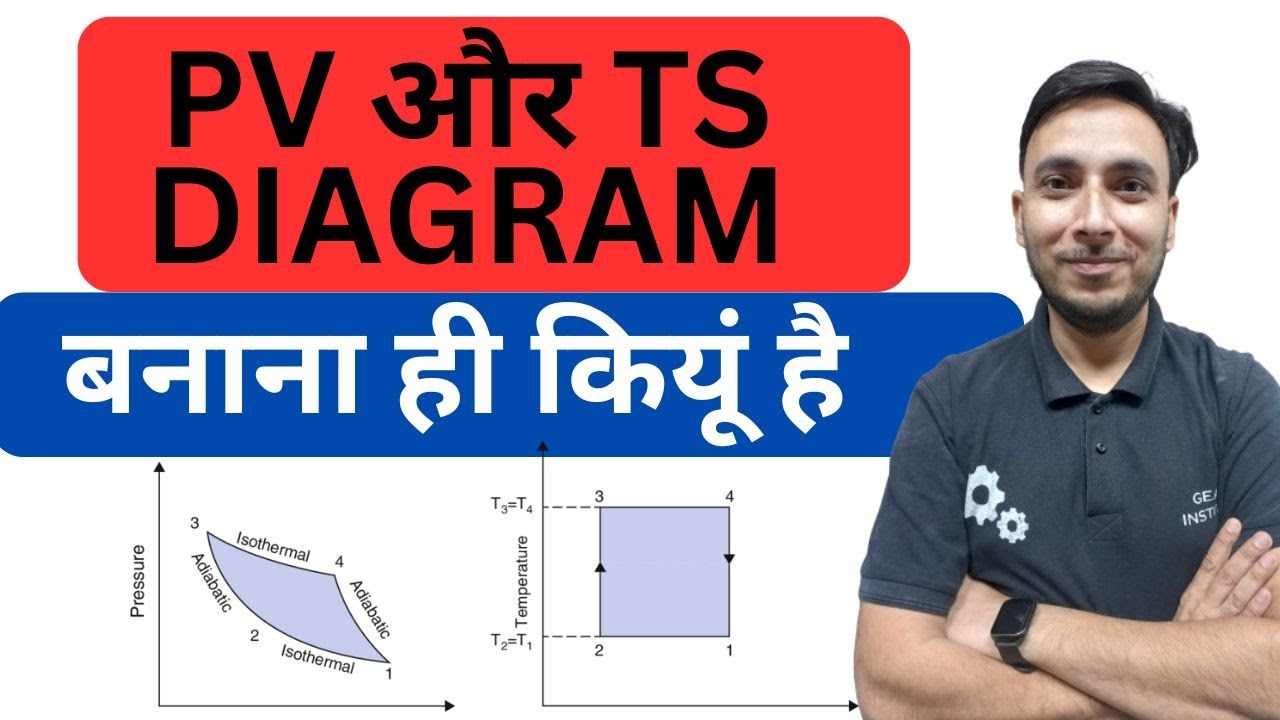
Difference between PV diagram and TS diagram in Carnot cycle ...
In the Carnot cycle, the PV diagram consists of two isothermal and two adiabatic curves. Similarly, in the TS (temperature-entropy) diagram, we have a rectangle representing the same cycle, with two isothermal processes and two adiabatic processes (represented by constant entropy lines).
What is the T-s diagram?
Temperature–entropy diagram - Wikipedia
In thermodynamics, a temperature–entropy (T–s) diagram is a thermodynamic diagram used to visualize changes to temperature (T ) and specific entropy (s) during a thermodynamic process or cycle as the graph of a curve.
What is the PV diagram?
A pressure–volume diagram (or PV diagram, or volume–pressure loop) is used to describe corresponding changes in volume and pressure in a system. They are commonly used in thermodynamics, cardiovascular physiology, and respiratory physiology.
What is the SI unit of PV?
Answer: The SI unit of the product of pressure (P) and volume (V) is the pascal cubic meter (Pa·m³) ..
What is the SI unit of PV nRT?
In SI units, p is measured in pascals, V is measured in cubic metres, n is measured in moles, and T in kelvins (the Kelvin scale is a shifted Celsius scale, where 0.00 K = −273.15 °C, the lowest possible temperature). R has for value 8.314 J/(mol. K) = 1.989 ≈ 2 cal/(mol. K), or 0.0821 L⋅atm/(mol⋅K).
What is constant PV?
PV=nRT. The ideal gas Law PV = nRT. Robert Boyle found PV = a constant. That is, the product of the pressure of a gas times the volume of a gas is a constant for a given sample of gas. In Boyle's experiments the Temperature (T) did not change, nor did the number of moles (n) of gas present.
What is pv and ts in thermodynamics
What is pv and ts diagram
What is pv and ts pdf
p-v and t-s diagram for all process
p-v and t-s diagram of rankine cycle
pv and ts diagram of diesel cycle
p-v and t-s diagram of carnot cycle
isothermal process pv and ts diagram
Повторяем попытку...
Доступные форматы для скачивания:
Скачать видео
-
Информация по загрузке:


