How to Operate an ELISA Microplate for Absorbance Measurement
Автор: Ucallm Biology
Загружено: 2026-01-11
Просмотров: 79
Описание:
Measuring absorbance is the final, critical step in a colorimetric ELISA, determining the quantitative result. Proper operation ensures accuracy and reproducibility. Below is a concise guide to the standard operating procedure.
I. Pre-Read Preparation
Reaction Termination: Add the stop solution (e.g., sulfuric acid for TMB substrate) as per protocol. The color will change (e.g., blue to yellow) and stabilize.
Bubble Removal: Gently tap the plate or briefly centrifuge it (300 x g, 1 min) to dislodge bubbles at the well bottom, which scatter light and cause errors.
Bottom Cleaning: Wipe the underside of the plate with a lint-free tissue moistened with ethanol or water to remove fingerprints, dust, or droplets.
II. Microplate Reader Setup
Instrument Warm-up: Turn on the reader and software. Allow the lamp to warm up for the time specified in the manual (typically 15-30 min).
Method Selection: Open a new absorbance/endpoint assay protocol.
Wavelength Setting:
Primary Wavelength: Set to the optimal absorbance peak of your chromogen. For stopped TMB, this is 450 nm.
Reference Wavelength (Optional but Recommended): Set to a wavelength where the chromogen does not absorb (e.g., 620 nm or 650 nm). The reader will subtract this background, correcting for plate imperfections. The reported value is A450 – A620.
III. Plate Reading & Data Acquisition
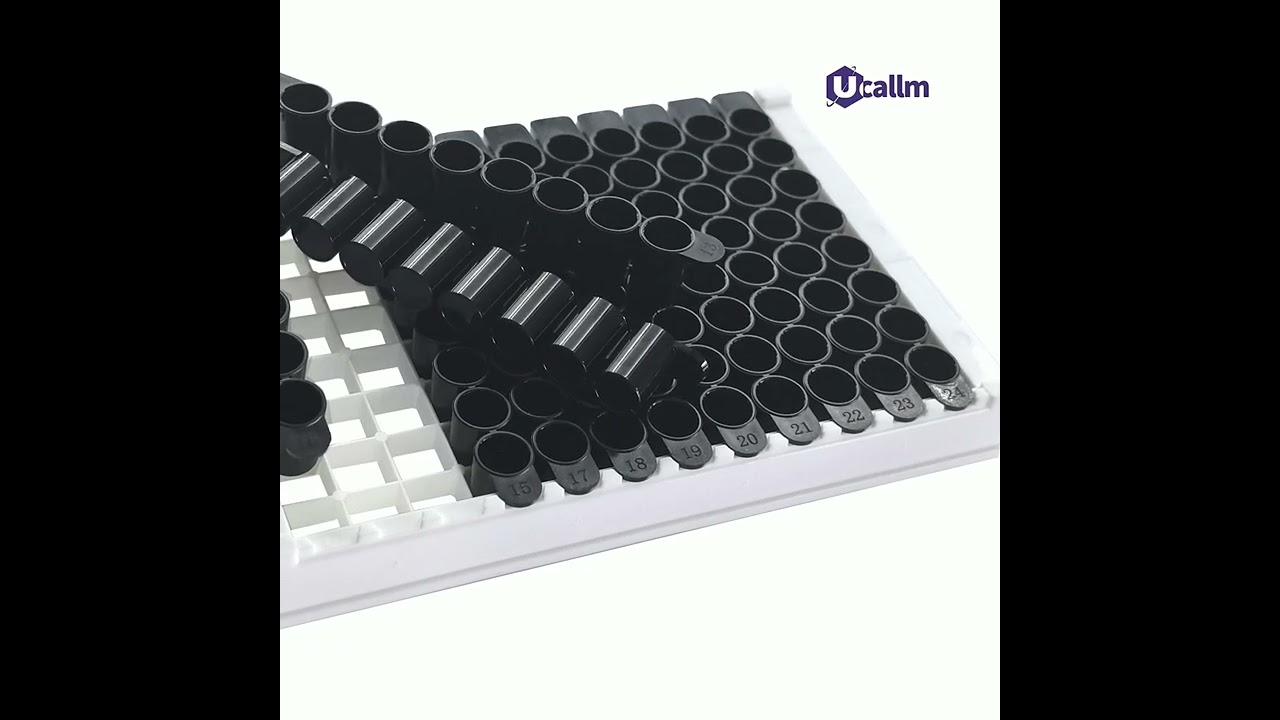
Plate Loading: Place the ELISA plate correctly in the carriage, aligning well A1 with the reader's designated position.
Plate Layout Definition: In the software, label the wells according to your plate map (e.g., Standard 1-7, Samples, Blank, Controls). This is essential for automated analysis.
Initiate Read: Start the reading process. The reader will scan each well.
Raw Data Output: The software generates a table of absorbance (Optical Density, OD) values for each well.
IV. Essential Data Processing Steps
Blank Correction: Subtract the average OD of your blank wells (containing only substrate + stop solution) from all other OD values. Most software performs this automatically during setup.
Standard Curve Generation:
Plot the corrected OD values of the standard wells against their known concentrations.
Apply the appropriate curve fit (e.g., linear regression for a linear range, or a 4-parameter logistic/sigmoidal curve for a typical binding assay).
Sample Calculation: Use the standard curve equation to interpolate the concentration of unknown samples from their blank-corrected OD values.
V. Key Considerations & Troubleshooting
Dynamic Range: Ensure sample ODs fall within the linear portion of the standard curve. Samples with ODs above the highest standard (Hook Effect) or below the lowest standard must be re-assayed at an appropriate dilution.
Timing: Read the plate promptly after stopping the reaction (usually within 30 minutes) to prevent potential signal drift.
Consistency: Use the same reading parameters (wavelengths, integration time) for all plates within an experiment.
Conclusion
Proper absorbance measurement is a systematic process. Careful pre-read preparation, correct instrument settings, and mandatory data processing (blank subtraction and curve fitting) are non-negotiable for transforming raw optical signals into reliable, quantitative biological data. Always consult your specific ELISA kit protocol for any deviations from this general guideline.
Повторяем попытку...
Доступные форматы для скачивания:
Скачать видео
-
Информация по загрузке: