Скачать
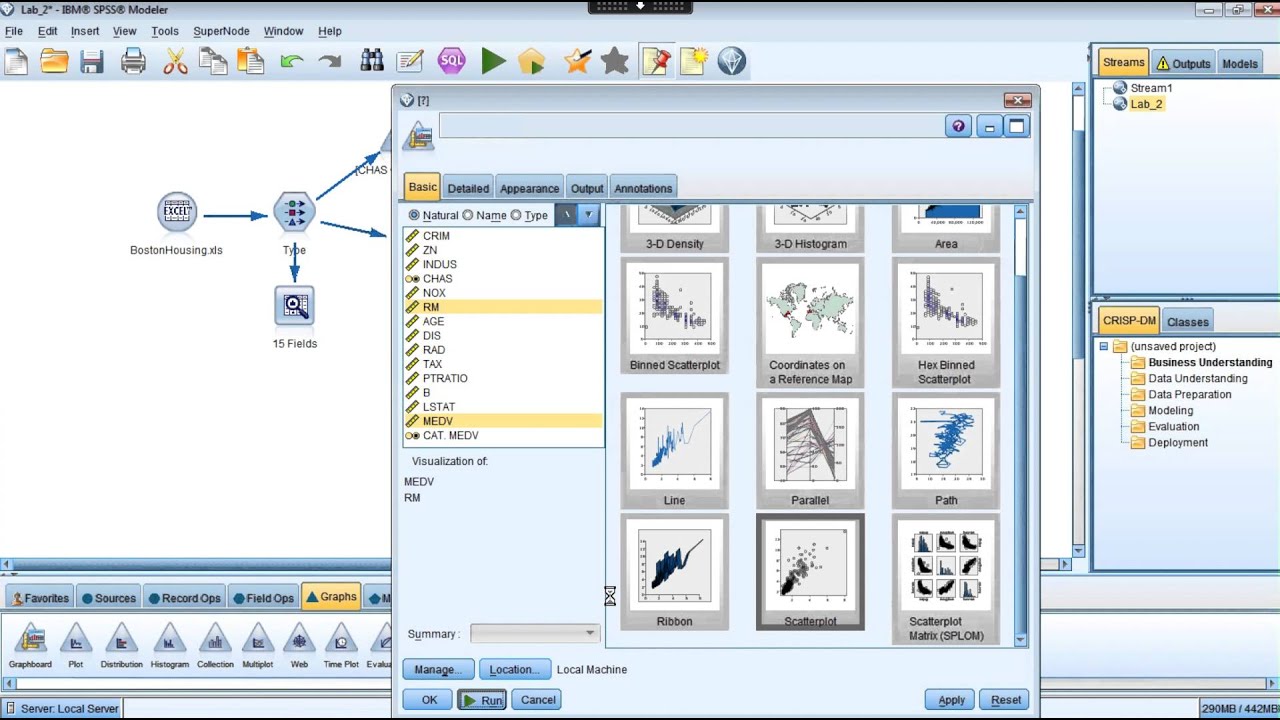
Data Visualization Using IBM SPSS Modeler
Автор: THE IT CHANNEL
Загружено: 2015-11-06
Просмотров: 12959
Описание: This video shows you how to use IBM SPSS Modeler to visualize a dataset by using different charts including scatterplot, bar chart, histogram, box plot, scatterplot matrix, and parallel coordinate. In our example, we use Boston Housing dataset for illustration. Hope you enjoy the tutorial and let me know if you have any questions. Thanks.
Не удается загрузить Youtube-плеер. Проверьте блокировку Youtube в вашей сети.
Повторяем попытку...
Повторяем попытку...
Доступные форматы для скачивания:
Скачать видео
-
Информация по загрузке: