ycliper

Популярное

Музыка Кино и Анимация Автомобили Животные Спорт Путешествия Игры Юмор

Интересные видео

2025 Сериалы Трейлеры Новости Как сделать Видеоуроки Diy своими руками

Топ запросов

смотреть а4 schoolboy runaway турецкий сериал смотреть мультфильмы эдисон
Скачать

Comprehensive Guide to Power BI Visuals

Автор: Pragmatic Works

Загружено: 2023-02-14

Просмотров: 25381

Описание: In this video, Allison goes over almost all of the regular visuals that are in the Power BI Desktop. She shows how to bring data into the visuals and modify them in the Formatting. Comment below if you have any questions about certain visuals.
 
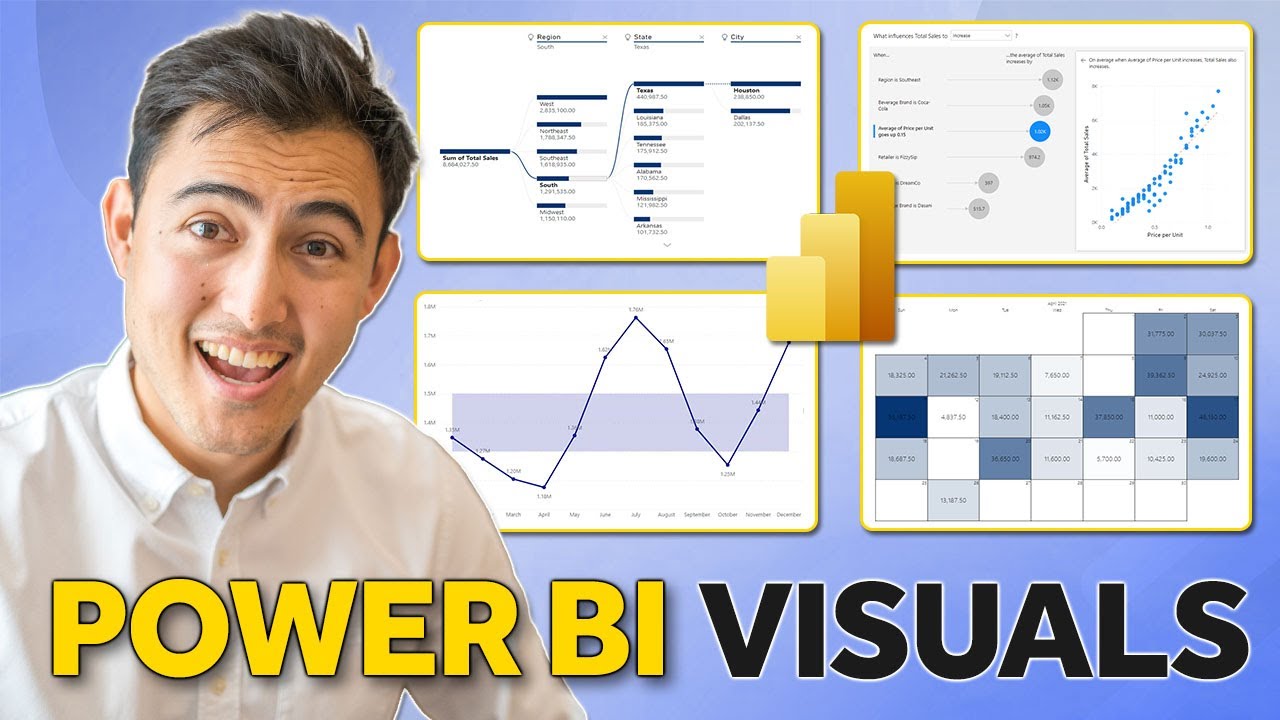
Visuals covered: Stacked Bar Chart, Stacked Line Chart, Clustered Bar Chart, Clustered Column Chart, 100% Stacked Bar Chart, 100% Stacked Column Chart, Line Chart, Area Chart, Line and Stacked Column Chart, Line and Clustered Column Chart, Waterfall, Funnel, Scatter Chart, Pie Chart, Donut Chart, Treemap, Card, Slicer, Map, Filled Map, Shape Map, and Azure Map.

Link Mentioned in Video: https://learning.pragmaticworkstraini...

👍 If you enjoy this video and are interested in formal training on Microsoft Teams, Power BI, Power Apps, Azure, or other Microsoft products you can use my code "Allison30" at check out when purchasing our On-Demand Learning classes to get an extra 30% off - https://pragmaticworks.com/pricing/
-- - - - - - - - - - - - - - - - - - - - - - - - - - - - - - - - - - - - - - - - - - - - - -- - - - - - - - - - - - - - - - - - - - - - - -
Next step on your journey:

👉 On-Demand Learning - Start With The FREE Community Plan: https://tinyurl.com/2ujujsb5

🔗Pragmatic Works On-Demand Learning Packages: https://pragmaticworks.com/pricing/
🔗Pragmatic Works Boot Camps: https://pragmaticworks.com/boot-camps/
🔗Pragmatic Works Hackathons: https://pragmaticworks.com/private-tr...
🔗Pragmatic Works Virtual Mentoring: https://pragmaticworks.com/virtual-me...
🔗Pragmatic Works Enterprise Private Training: https://pragmaticworks.com/private-tr...
🔗Pragmatic Works Blog: http://blog.pragmaticworks.com/

Let's connect:

✔️Twitter:   / pragmaticworks  
✔️Facebook:   / pragmaticworks  
✔️Instagram:   / pragmatic.works  
✔️LinkedIn:   / pragmaticworks  
✔️YouTube:    / pragmaticworks  


Pragmatic Works
7175 Hwy 17, Suite 2 Fleming Island, FL 32003
Phone: (904) 638-5743
Email: [email protected]
#PragmaticWorks

Не удается загрузить Youtube-плеер. Проверьте блокировку Youtube в вашей сети.
Повторяем попытку...
Comprehensive Guide to Power BI Visuals

Поделиться в:

Доступные форматы для скачивания:

Скачать видео

  • Информация по загрузке:

Скачать аудио

Похожие видео

Color Theory for Report Designers and Data Analysts

Color Theory for Report Designers and Data Analysts

Free Event: Power BI Beginner to Pro 2026 Edition - Full Hands-On Tutorial

Free Event: Power BI Beginner to Pro 2026 Edition - Full Hands-On Tutorial

This Power BI Trick Feels Illegal... Dynamic Ranking with Visual Calculations and Field Parameters

This Power BI Trick Feels Illegal... Dynamic Ranking with Visual Calculations and Field Parameters

Introducing VISUAL SHAPE for visual calculations in Power BI

Introducing VISUAL SHAPE for visual calculations in Power BI

Want PROFESSIONAL Data Visualization? Watch This Power BI Course Now!

Want PROFESSIONAL Data Visualization? Watch This Power BI Course Now!

TTRA Partner Webinar with Azira - Hands-On Workshop: From Location Data to Destination Action

TTRA Partner Webinar with Azira - Hands-On Workshop: From Location Data to Destination Action

Upgrade Your REPORT DESIGN in Power BI | Complete Walkthrough From A to Z

Upgrade Your REPORT DESIGN in Power BI | Complete Walkthrough From A to Z

Power BI DAX Tutorial for Beginners (2025): Master DAX in ONE Course!

Power BI DAX Tutorial for Beginners (2025): Master DAX in ONE Course!

[[ 4.5 HOURS ]] Complete Power BI Visuals / Charts / Dashboards - { End to End } Full Course

[[ 4.5 HOURS ]] Complete Power BI Visuals / Charts / Dashboards - { End to End } Full Course

Popular Visualizations in Power BI | Microsoft Power BI for Beginners

Popular Visualizations in Power BI | Microsoft Power BI for Beginners

Visualizations in Power BI - Full Tutorial

Visualizations in Power BI - Full Tutorial

Creating a Power BI Report Theme

Creating a Power BI Report Theme

ULTIMATE Power BI Tutorial 📊 Beginner to Pro Course (2024)

ULTIMATE Power BI Tutorial 📊 Beginner to Pro Course (2024)

ОСВОЕНИЕ столбчатых диаграмм в Power BI | Больше никаких вырезаемых меток

ОСВОЕНИЕ столбчатых диаграмм в Power BI | Больше никаких вырезаемых меток

Report or Dashboard in Power BI

Report or Dashboard in Power BI

Top 5 Awesome Power BI Visuals You Probably Didn't Know

Top 5 Awesome Power BI Visuals You Probably Didn't Know

How to use Drill Through in Power BI. 👆 ONE click from chart to details

How to use Drill Through in Power BI. 👆 ONE click from chart to details

НОВЫЙ Power BI Card Visual, ноябрь 2023 г. | Полное руководство от базового до продвинутого уровн...

НОВЫЙ Power BI Card Visual, ноябрь 2023 г. | Полное руководство от базового до продвинутого уровн...

Использование параметров полей Power BI для добавления срезов мер в отчет

Использование параметров полей Power BI для добавления срезов мер в отчет

Easiest Way to Edit Visuals in Power BI - Watch before using the new features (Includes hidden tips)

Easiest Way to Edit Visuals in Power BI - Watch before using the new features (Includes hidden tips)

© 2025 ycliper. Все права защищены.


  • Контакты
  • О нас
  • Политика конфиденциальности


Контакты для правообладателей: [email protected]