ycliper

Популярное

Музыка Кино и Анимация Автомобили Животные Спорт Путешествия Игры Юмор

Интересные видео

2025 Сериалы Трейлеры Новости Как сделать Видеоуроки Diy своими руками

Топ запросов

смотреть а4 schoolboy runaway турецкий сериал смотреть мультфильмы эдисон
Скачать

ANOVA Factorial Experiment, Example 159.2tech

Автор: Dane McGuckian (STATSprofessor)

Загружено: 2019-10-24

Просмотров: 2273

Описание: 
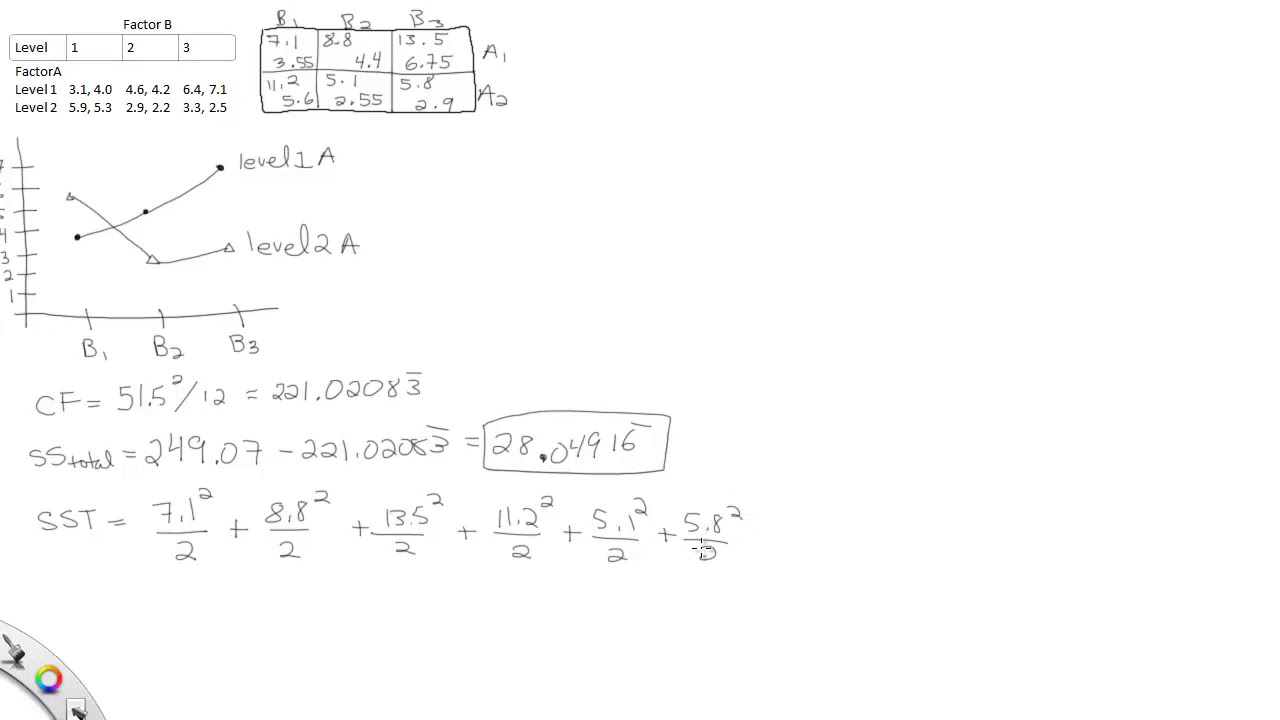
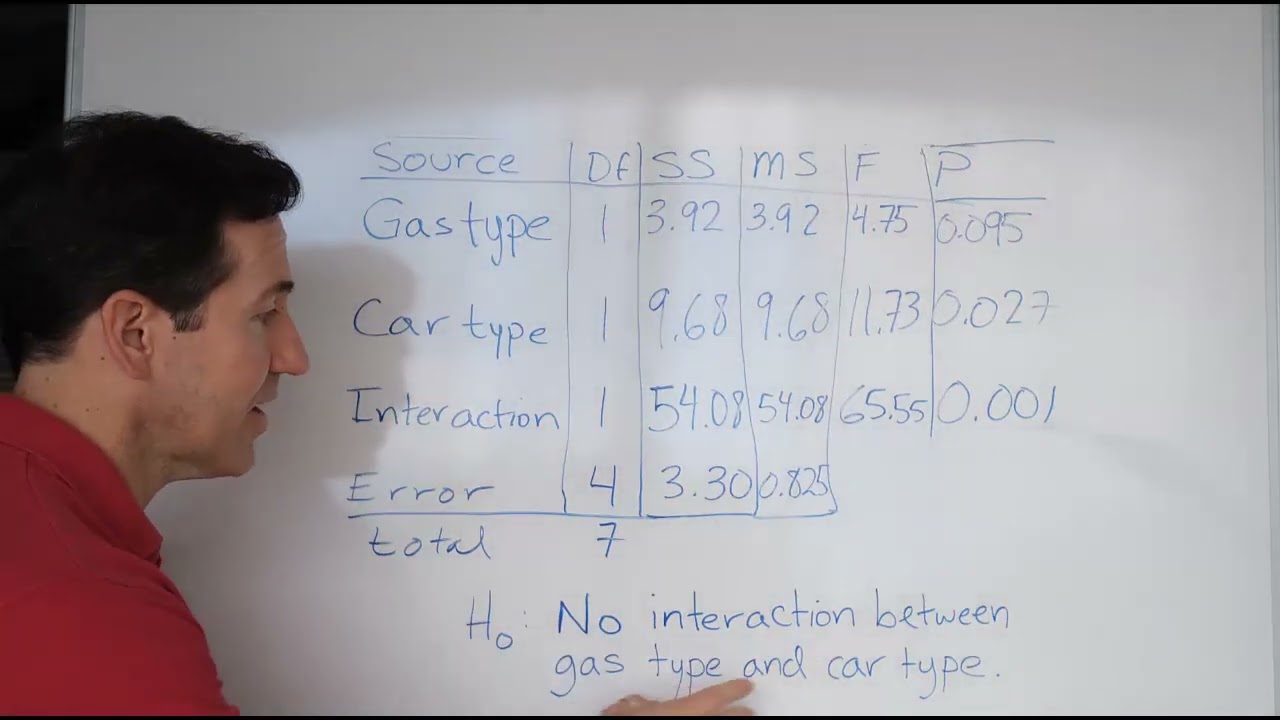
In this video, we demonstrate how to analyze data from a factorial design experiment using ANOVA output provided by SPSS software. In this example on the topic, we will use computer output instead of performing the calculations by hand. However, we will also show how to complete an ANOVA table that is only partially filled in.

This video is part of the content available for free at https://www.statsprofessor.com

Не удается загрузить Youtube-плеер. Проверьте блокировку Youtube в вашей сети.
Повторяем попытку...
ANOVA Factorial Experiment, Example 159.2tech

Поделиться в:

Доступные форматы для скачивания:

Скачать видео

  • Информация по загрузке:

Скачать аудио

Похожие видео

ANOVA Factorial Experiment Analyzed by Hand

ANOVA Factorial Experiment Analyzed by Hand

F Test for Two Variances   Confidence Interval & Hypothesis Testing Explained

F Test for Two Variances Confidence Interval & Hypothesis Testing Explained

Нахождение биномиальной вероятности с помощью Excel

Нахождение биномиальной вероятности с помощью Excel

ANOVA Factorial Experiment, Example 159.1tech

ANOVA Factorial Experiment, Example 159.1tech

Excel Videos

Excel Videos

Introductory Statistics | Chapter 02 | Visual Summaries of Data

Introductory Statistics | Chapter 02 | Visual Summaries of Data

Testing for an Interaction in Two-Way ANOVA

Testing for an Interaction in Two-Way ANOVA

Bad Bunny's Apple Music Super Bowl Halftime Show

Bad Bunny's Apple Music Super Bowl Halftime Show

Using Excel and Chebyshev's Theorem to Find the Minimum Percentage of Data In an Interval

Using Excel and Chebyshev's Theorem to Find the Minimum Percentage of Data In an Interval

Эмпирическое правило: Академия Хана

Эмпирическое правило: Академия Хана

ATTU Cup 2026 - Round 16 - Chen Yi vs Hina Hayata

ATTU Cup 2026 - Round 16 - Chen Yi vs Hina Hayata

Nawrocki grzmi: na litość boską,musimy wiedzieć,czy marszałek ma dostęp do informacji ściśle tajnych

Nawrocki grzmi: na litość boską,musimy wiedzieć,czy marszałek ma dostęp do informacji ściśle tajnych

A useful way to think about money and government debt (for a country that controls its currency).

A useful way to think about money and government debt (for a country that controls its currency).

Using the Excel Data tab to construct a Histogram and to create class boundaries.

Using the Excel Data tab to construct a Histogram and to create class boundaries.

Performing Simple Linear Regression Using the Formulas

Performing Simple Linear Regression Using the Formulas

ANOVA in Statistics || Two Way ANOVA || Easy Way for Difficult Calculations

ANOVA in Statistics || Two Way ANOVA || Easy Way for Difficult Calculations

FULL MATCH | Wang Manyu vs Wang Yidi | Asian Cup 2026

FULL MATCH | Wang Manyu vs Wang Yidi | Asian Cup 2026

Calculating Pearson's Correlation Coefficient Using the Formula for R and Excel

Calculating Pearson's Correlation Coefficient Using the Formula for R and Excel

Using the complement of

Using the complement of "At least one" to find a probability

Введение в статистику | Организация непрерывных данных | Практическое задание

Введение в статистику | Организация непрерывных данных | Практическое задание

© 2025 ycliper. Все права защищены.


  • Контакты
  • О нас
  • Политика конфиденциальности


Контакты для правообладателей: [email protected]