Measuring and Graphing Quantities
Автор: Bozeman Science
Загружено: 2024-02-14
Просмотров: 1945
Описание:
Practice Slides: https://drive.google.com/file/d/1Bg_r...
The Wonder of Science: https://thewonderofscience.com/mlsep52
Student Worksheet: InsertURLHere
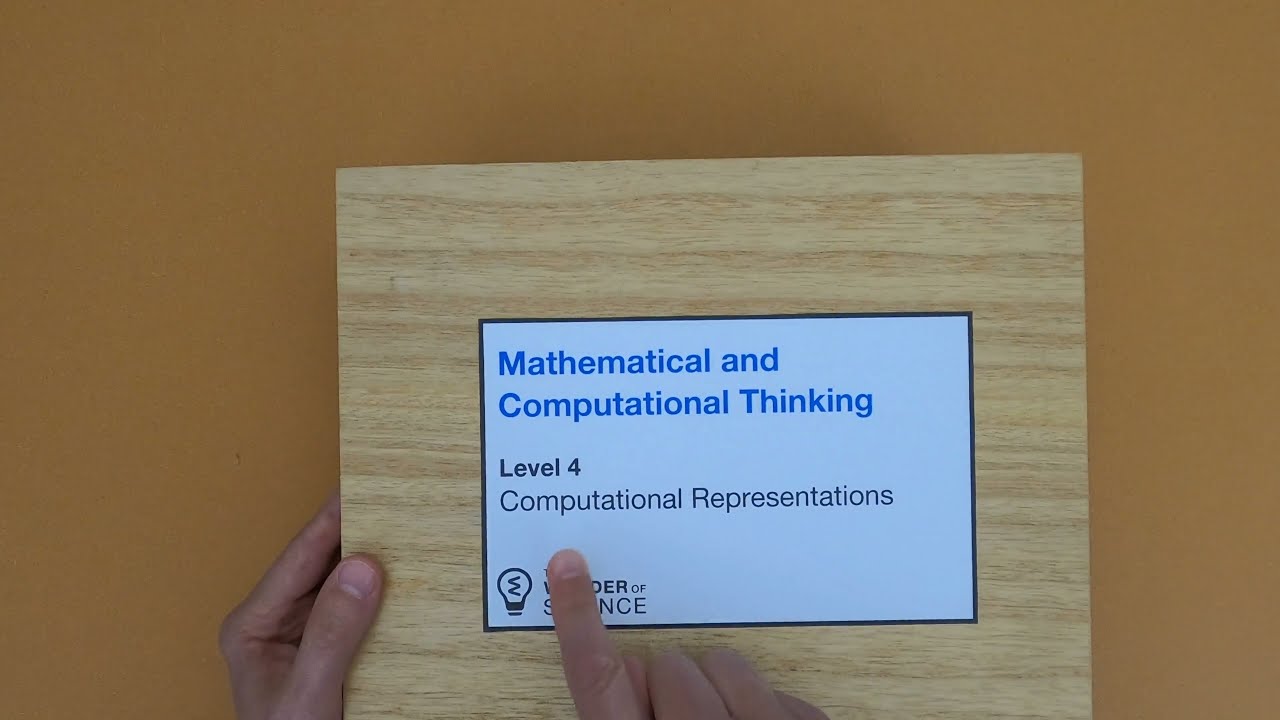
Mathematical and Computational Thinking - Level 2: Measuring and Graphing Quantities
In this video Paul Andersen shows you how to use mathematical and computational thinking in a mini-lesson on measuring and graphing quantities. Two examples are included in the video and two additional examples are included in the linked thinking slides.
TERMS
Describe - to give an account in words
Graph - a graphical representation of data
Measure - the collection of quantitative or mathematical data
Quantity - the amount (or number) of a thing
Weight - quantity of matter in an object
This progression is based on the Science and Engineering Practices elements from the NRC document A Framework for K-12 Science Education. “Describe, measure and graph quantities such as weight to address questions.”
Source: https://www.nextgenscience.org/
Повторяем попытку...

Доступные форматы для скачивания:
Скачать видео
-
Информация по загрузке:


![Эффект Джанибекова [Veritasium]](https://imager.clipsaver.ru/N9HlQ-XVnFk/max.jpg)


![Как измеряют самые слабые силы во Вселенной? [Veritasium]](https://imager.clipsaver.ru/6lK2JVwajTw/max.jpg)