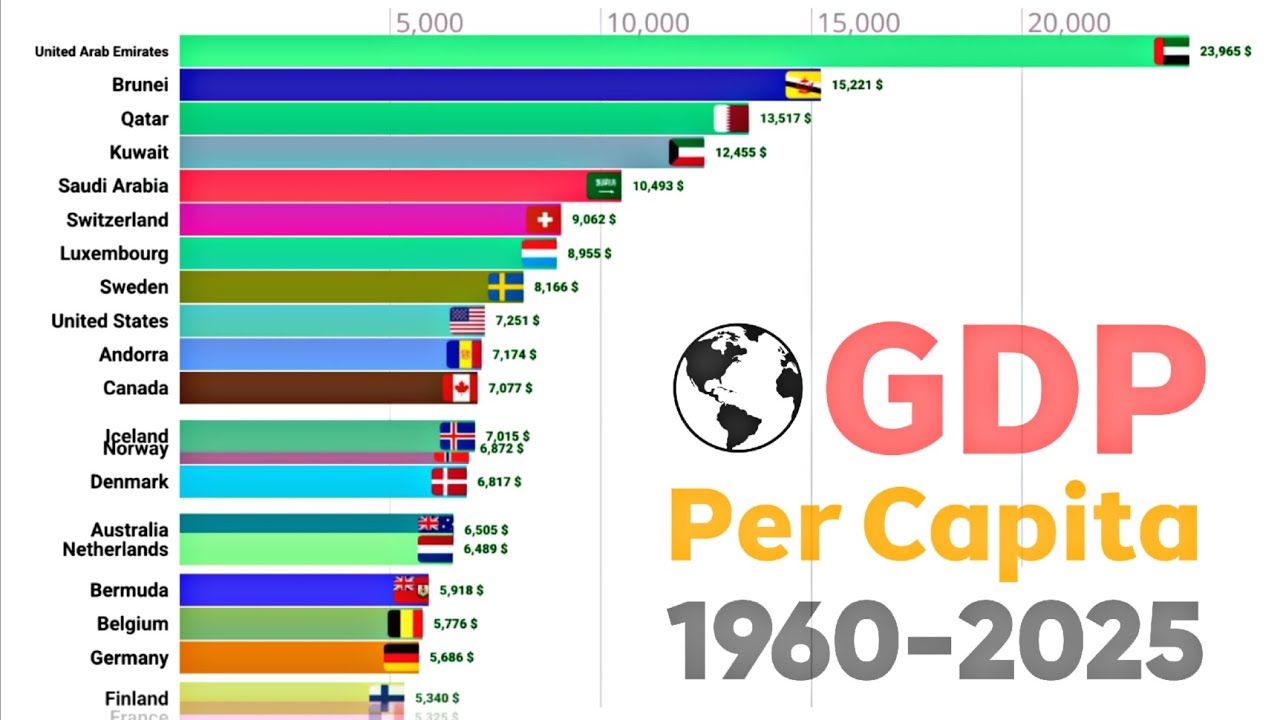
GDP Per Capita (1960-2025) World Economic Growth Bar Chart Race
Автор: ishowdata
Загружено: 2025-02-28
Просмотров: 1010
Описание:
GDP Per Capita (1960-2025) World Economic Growth Data Analytics
WHAT'S THE WORLD'S GDP PER CAPITA FROM 1960 TO 2025?
Explore the fascinating journey of the world's GDP per capita from 1960 to 2025! In this video, we'll dive into a comprehensive data analysis, revealing the remarkable growth and shifts in the global economy over the past six decades. From the rapid industrialization of the 1960s to the modern era of technological advancements, we'll examine the trends, patterns, and insights that have shaped the world's economic landscape. Get ready to uncover the surprising facts and figures that have contributed to the world's GDP per capita, and discover how it has impacted our daily lives.
Welcome to our deep dive into the world’s GDP per capita from 1960 to 2025. In this video, we’ll explore how economic growth has shaped nations and affected lives across the globe.
Let's start by understanding GDP per capita. This figure represents the average economic output per person, providing insights into the standard of living and economic health of a country. Over the past six decades, we’ve seen significant fluctuations driven by various factors, including technology, politics, and global events.
From 1960, the world average GDP per capita was just over $3,000. Fast forward to the late 1980s, and we see growth spurred by globalization. Nations began to open their markets, leading to increased trade and investment. By 2000, that number had risen to nearly $7,000.
The 2008 financial crisis posed major challenges, but recovery was swift in many regions. By 2019, global GDP per capita touched around $11,000. However, the pandemic of 2020 had a significant impact, causing a temporary decline.
Looking ahead to 2025, predictions indicate a rebound, with estimates suggesting the world average could reach approximately $14,000. This growth won't be uniform; disparities between countries will continue to widen, highlighting the varying rates of recovery and development.
Join us as we analyze this data further, revealing the trends and implications for countries around the world.
Keywords:
GDP,
GDP per capita,
world economy,
economic growth,
historical GDP,
GDP trends,
global economy,
economic statistics,
1960 to 2025,
economic data,
financial analysis,
income per person,
economic development,
world statistics,
GDP comparison,
economic history,
international economics,
data visualization,
economic indicators,
global financial trends
Data analytics,
Bar chart race,
Data comparison,
Country comparison,
Thank you for watching, and don’t forget to subscribe to our channel for more insightful content!
#GDP #Economics #DataAnalytics #BarChartRace #DataVisualization #WorldStatistic #EconomicData #CountryComparison #EconomicGrowth #GDPPerCapita #Stats #Data
Повторяем попытку...
Доступные форматы для скачивания:
Скачать видео
-
Информация по загрузке: