Скачать
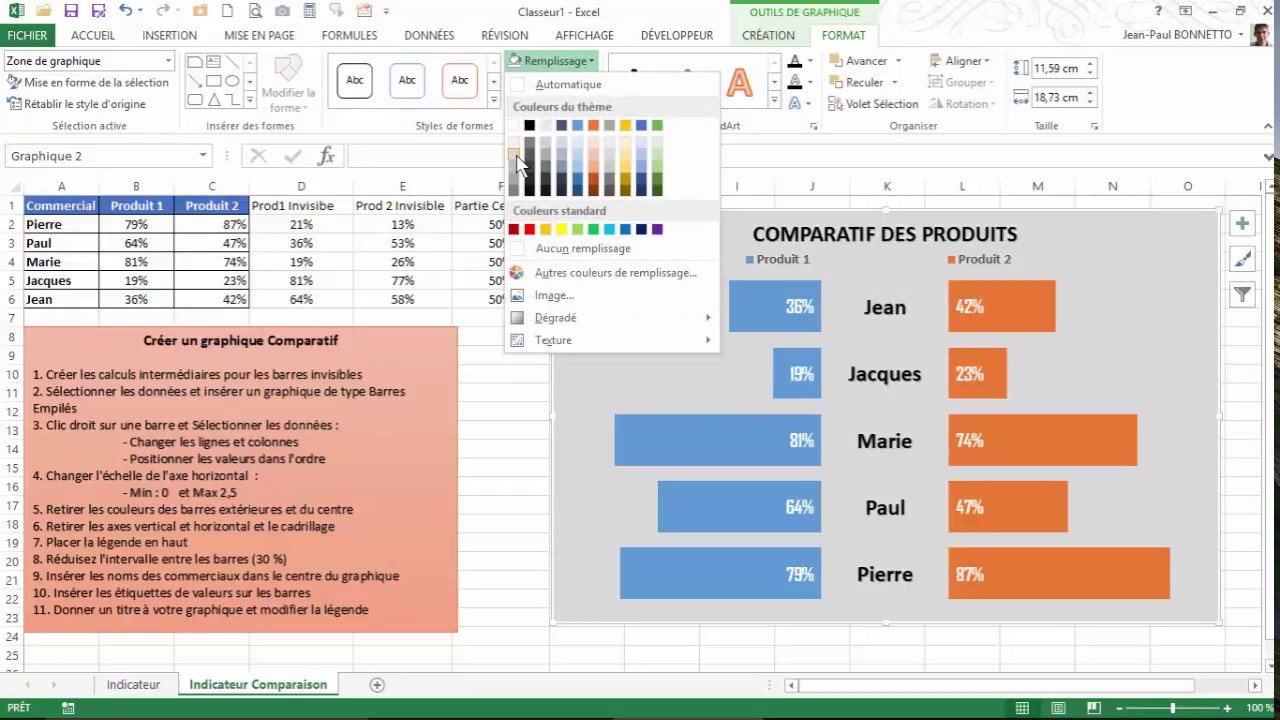
Excel - graphique type indicateur de comparaison
Автор: ASTUCES Microsoft Office
Загружено: 2023-11-04
Просмотров: 3296
Описание:
Dans cette vidéo je vous explique comment créer un graphique de type indicateur de comparaison Bon visionnage !
Abonne toi en cliquant ici : http://bit.ly/Astuces-Microsoft-Office
Не удается загрузить Youtube-плеер. Проверьте блокировку Youtube в вашей сети.
Повторяем попытку...
Повторяем попытку...

Доступные форматы для скачивания:
Скачать видео
-
Информация по загрузке: