How To Make A Climate Graph Using Google Sheets
Автор: Trader Jono Blueprint
Загружено: 2026-05-24
Просмотров: 49
Описание:
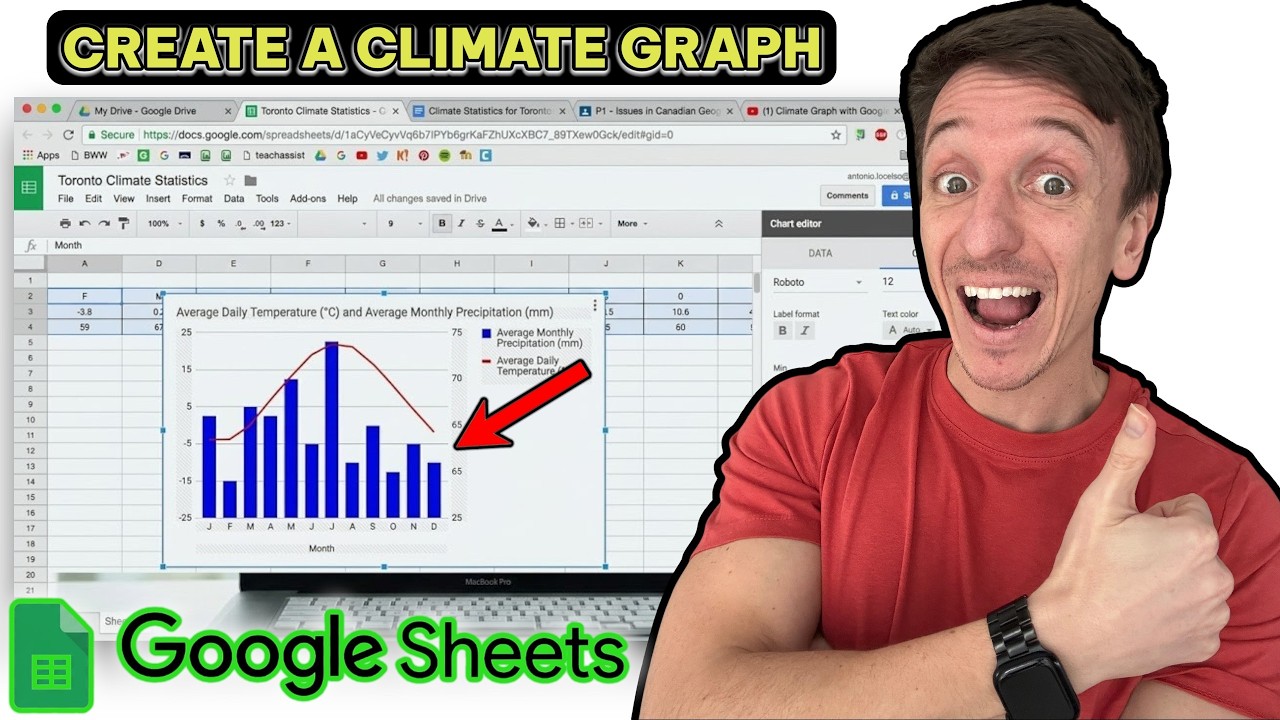
This tutorial provides a professional, step-by-step guide on how to create a climate graph in Google Sheets by combining temperature and precipitation data into a single visualization. You will learn how to structure your climate data, utilize the combo chart type to represent dual metrics, and configure axis settings for readability. By the end of this guide, you will be able to customize your chart with clear titles, smoothed trend lines, and dual-axis scaling to effectively display climate trends over time.
Video Chapters
0:00 - Introduction to Creating a Climate Graph
0:08 - Preparing and Selecting Climate Data
0:26 - Inserting and Selecting the Combo Chart Type
0:42 - Customizing Titles and Chart Styling
0:58 - Configuring Dual Vertical Axes for Precipitation and Temperature
1:12 - Adjusting Axis Scales and Adding Labels
1:36 - Finalizing and Reviewing the Climate Graph
Creator Transparency Disclosure: To ensure technical clarity and clear instructions, this guide is narrated by a professional AI voice. However, every step, troubleshooting tip, and editorial verdict is the result of 100% human-driven research and technical testing by our team using the latest 2026 software builds.
Editorial Transparency & Process: At Trader Jono Blueprint, we specialize in deep-dive investigations into technical workflows and platform stability across various software and applications. Our process is designed for educational purposes, focusing on the practical application and functionality of digital tools. Our human team leads every creative decision to ensure your results look professional without breaking your budget.
Business Enquiries: [email protected]
Повторяем попытку...
Доступные форматы для скачивания:
Скачать видео
-
Информация по загрузке: