Скачать
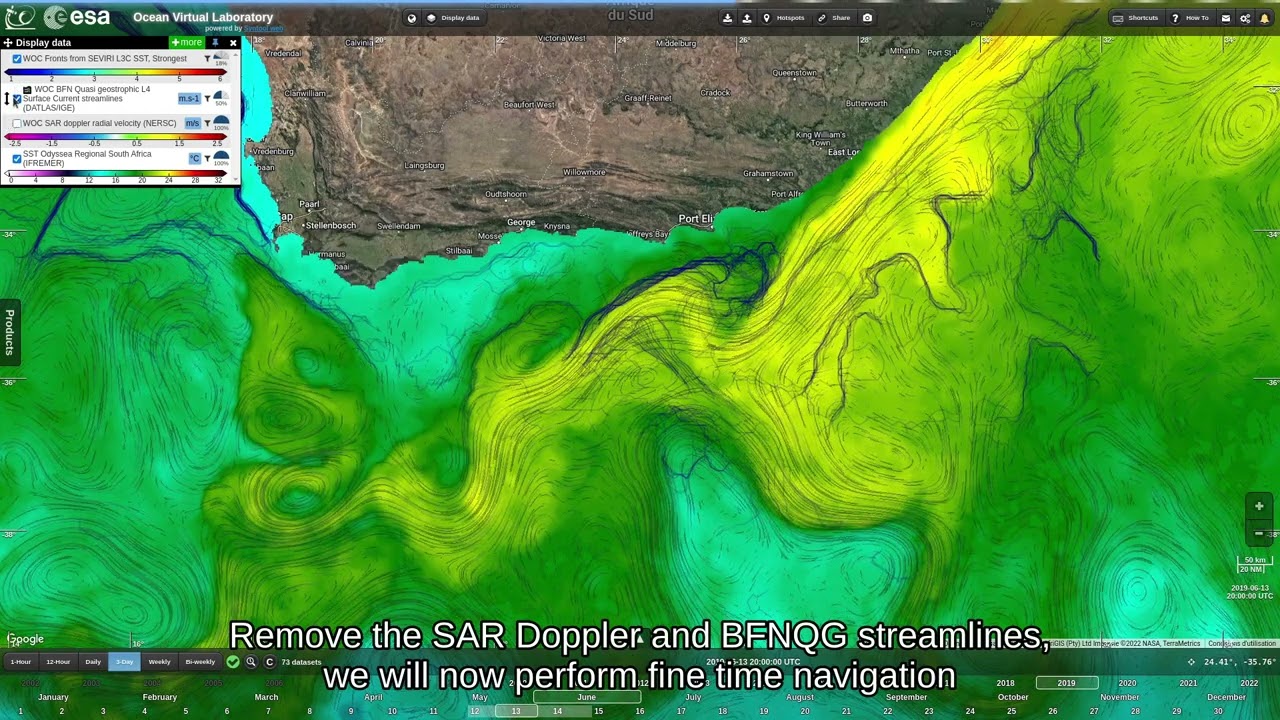
Ocean Virtual Lab portal Tutorial #4: How to draw a synoptic chart
Автор: OceanDataLab
Загружено: 2022-05-19
Просмотров: 124
Описание: In this video, we show how to draw a synoptic chart (polylines, polygons, eddies, mushrooms, add text ... ) on OVL web portal https://ovl.oceandatalab.com using Sentinel 3 data. You can practice on this test case on https://odl.bzh/IRQa9u7s.
Не удается загрузить Youtube-плеер. Проверьте блокировку Youtube в вашей сети.
Повторяем попытку...
Повторяем попытку...

Доступные форматы для скачивания:
Скачать видео
-
Информация по загрузке: