Small Multiple KPI Cards in Power BI with the HTML VizCeator Custom Visuals
Автор: BI Samurai / K Team Solutions
Загружено: 2023-02-14
Просмотров: 4711
Описание:
Creating Small Multiple KPI Cards in Power BI with the HTML VizcCeator Custom Visuals
Power BI provides various features to create and display information effectively. However, displaying multiple KPIs (Key Performance Indicators) on a single report can be challenging, especially when they have to fit in a limited space.
That's where small multiples come in. Small multiples are a series of similar graphics displayed side-by-side, each showing a different aspect of the data. They are an effective way to compare multiple KPIs, and the HTML VizCreator makes it easy to create them.
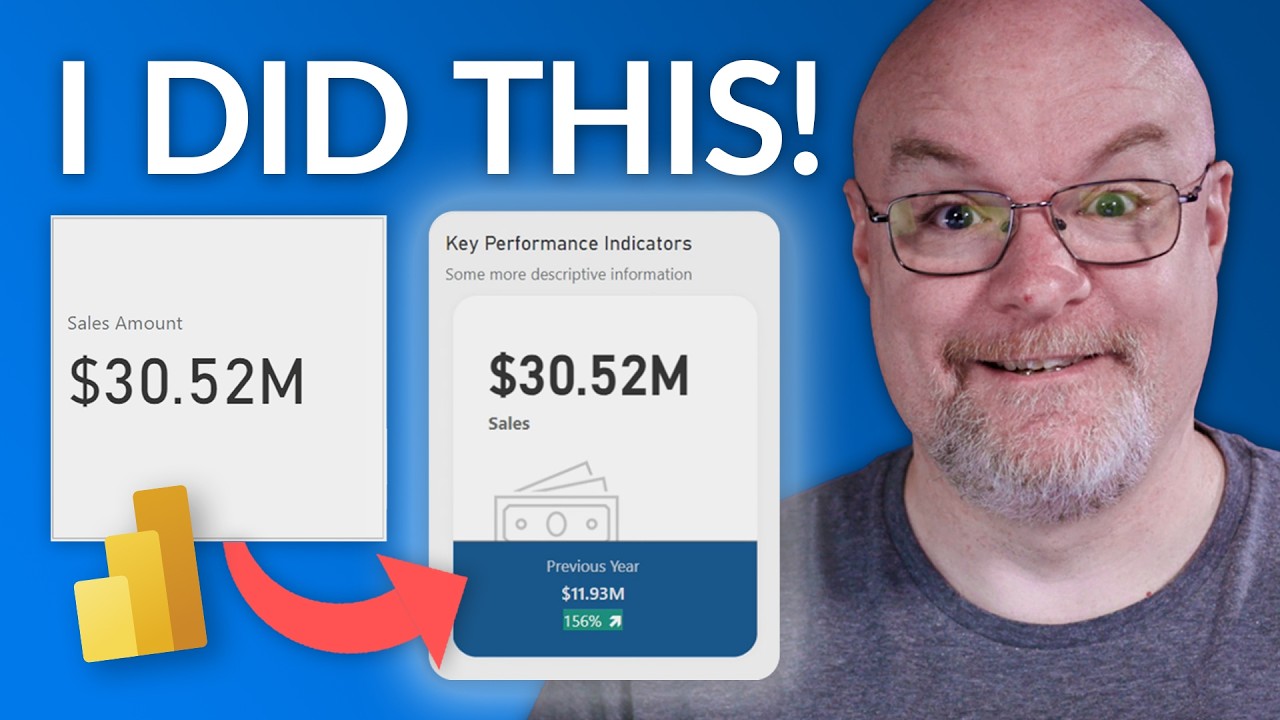
The best part is that you don't need to be an HTML expert to create these small multiple KPI cards. In the video below, we show you how you can create a custom card, starting from Excel. Or, you can use one of our pre-built templates. Simply get the HTML VizCreator visuals from the Power BI marketplace, and you're ready to go.
Advantages of Small Multiples in Power BI:
Easy Comparison: Small multiples make it easy to compare and contrast multiple KPIs, enabling you to quickly identify trends and patterns in the data.
Space-Efficient: By displaying multiple KPIs in a compact format, small multiples allow you to fit more information into a limited space, making it an ideal solution for creating dashboards with limited real estate.
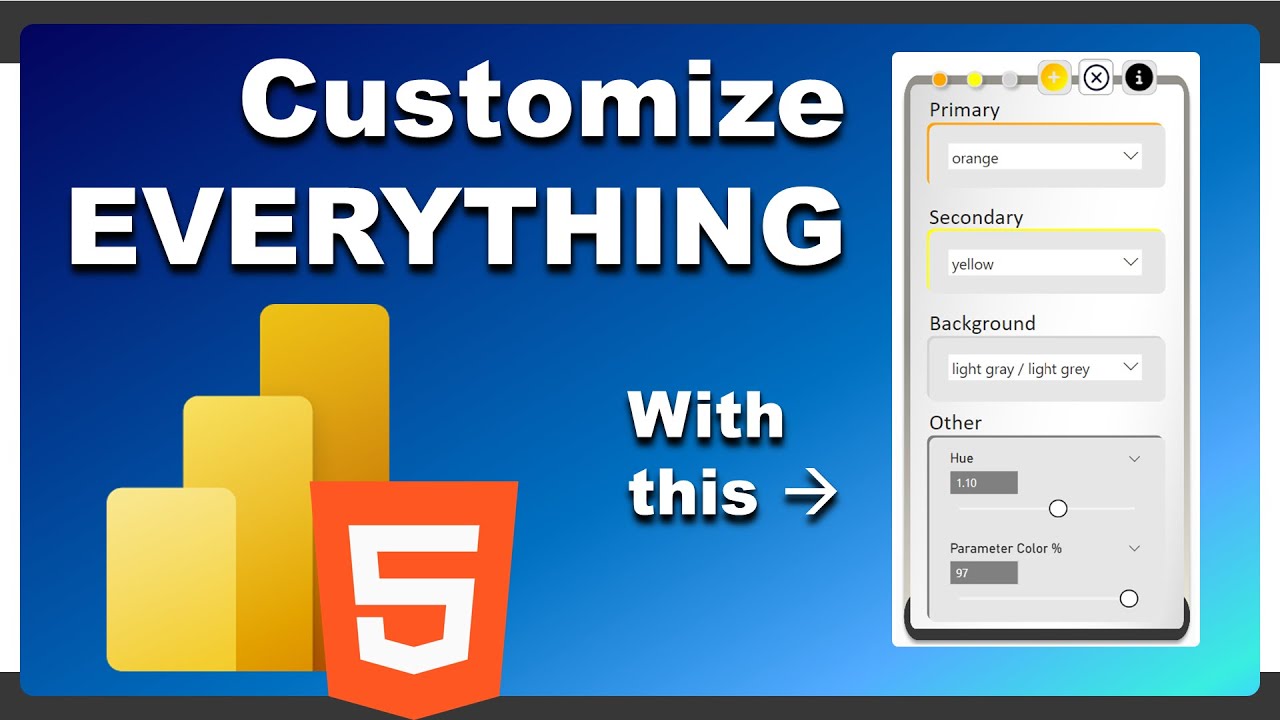
Customizable: The HTML VizCeator custom visuals provide a wide range of customization options, allowing you to tailor the appearance of your small multiples to meet your specific needs.
Improved Readability: Small multiples are designed to be easy to read, with clear labels and a consistent format for each KPI. This makes it easier to understand the information, even at a glance.
In conclusion, small multiples are an effective way to display multiple KPIs in Power BI, and the HTML VizCreator custom visuals make it easy to create them without any HTML knowledge. Whether you're looking to create a dashboard or analyze data, small multiples can help you get the most out of your data visualization efforts.
Download the report: https://bisamurai.com/custom-visuals-...
*************
💬 Did you enjoy this video? Let us know in the comment section below!
✨ If you liked this video, consider subscribing to the BI Samurai YouTube channel and activate the bell icon to stay notified whenever there is a new video released 🔔! ⤵️
https://www.youtube.com/c/KTeamSoluti...
*************
Hello and Welcome to the official YouTube Channel of BI Samurai ☑️
BI Samurai is a BI Consulting company based in Switzerland. We implement Business Intelligence Solutions for our clients.
Our main focus is Power BI, but we also work with other tools from the Power Platform or Azure data family.
We can take over the implementation of Power BI from A to Z but can also improve existing reports, help with performance problems or any other topic related to Power BI.
➡️ We also have our very own Power BI visuals
1️⃣ The HTML VizCreator (Microsoft certified) is a must-have for anyone who wants to seriously improve the reports. It allows the user to create custom elements using HTML.
2️⃣ The HTML VizCreator Flex can be used to create all sorts of dynamic elements and is a great addition to any Power BI report. It is more powerful than the HTML VizCreator Cert, but not Microsoft certified
3️⃣ The Balance Sheet Visual is great to display a balance sheet in a way that even non-finance-experts easily understand it.
*************
✅ Where to find out more about us:
Website ▶️ https://bisamurai.com
Support ▶️ https://bisamurai.com/support
HTML VizCreator Cert ▶️ https://bisamurai.com/html-vizcreator...
HTML VizCeator Flex ▶️ https://bisamurai.com/html-vizcreator...
✅ Follow BI Samurai on social media:
LinkedIn ▶️ / bisamurai
*************
#bisamurai #powerbi #powerplatform #azure #customvisuals #htmlvizcreator
Повторяем попытку...

Доступные форматы для скачивания:
Скачать видео
-
Информация по загрузке: