Скачать
Yahoo Finance and Plotly with Python, in Excel
Автор: PyXLL - Write Excel Add-Ins with Python and Java
Загружено: 2025-04-29
Просмотров: 700
Описание:
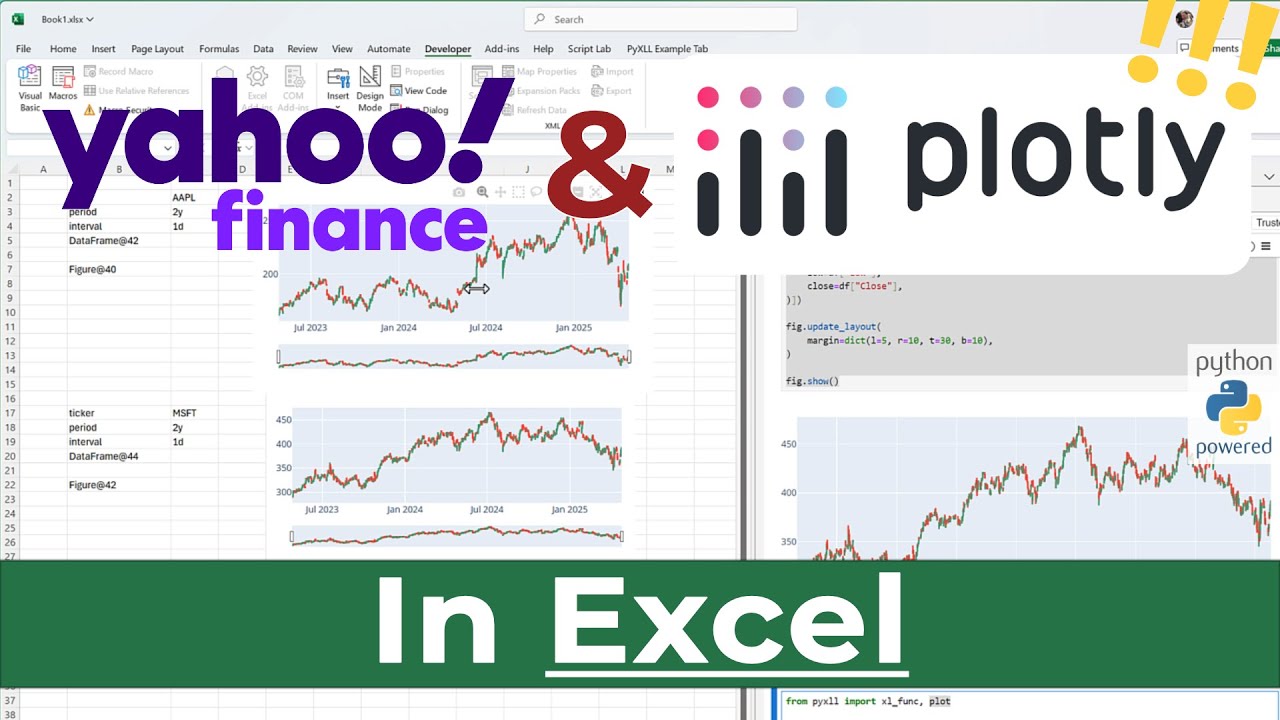
Use external data from Yahoo Finance and visulize it with interactive plotly charts, all in Excel, written in Python, with the Excel add-in PyXLL.
If you thought you couldn't load data external data using Python, in Excel, then this video shows you that actually it is not only possible, but easy if you choose the right tools.
Create interactive dashboards directly in Excel that are easy to use for other non-Python Excel users with plotly and the Python Excel add-in PyXLL.
Visit https://www.pyxll.com for more details about the PyXLL Excel add-in.
Не удается загрузить Youtube-плеер. Проверьте блокировку Youtube в вашей сети.
Повторяем попытку...
Повторяем попытку...
Доступные форматы для скачивания:
Скачать видео
-
Информация по загрузке: