What Is a Ticker Tape Diagram?
Автор: Video physical science
Загружено: 2015-10-05
Просмотров: 40245
Описание:
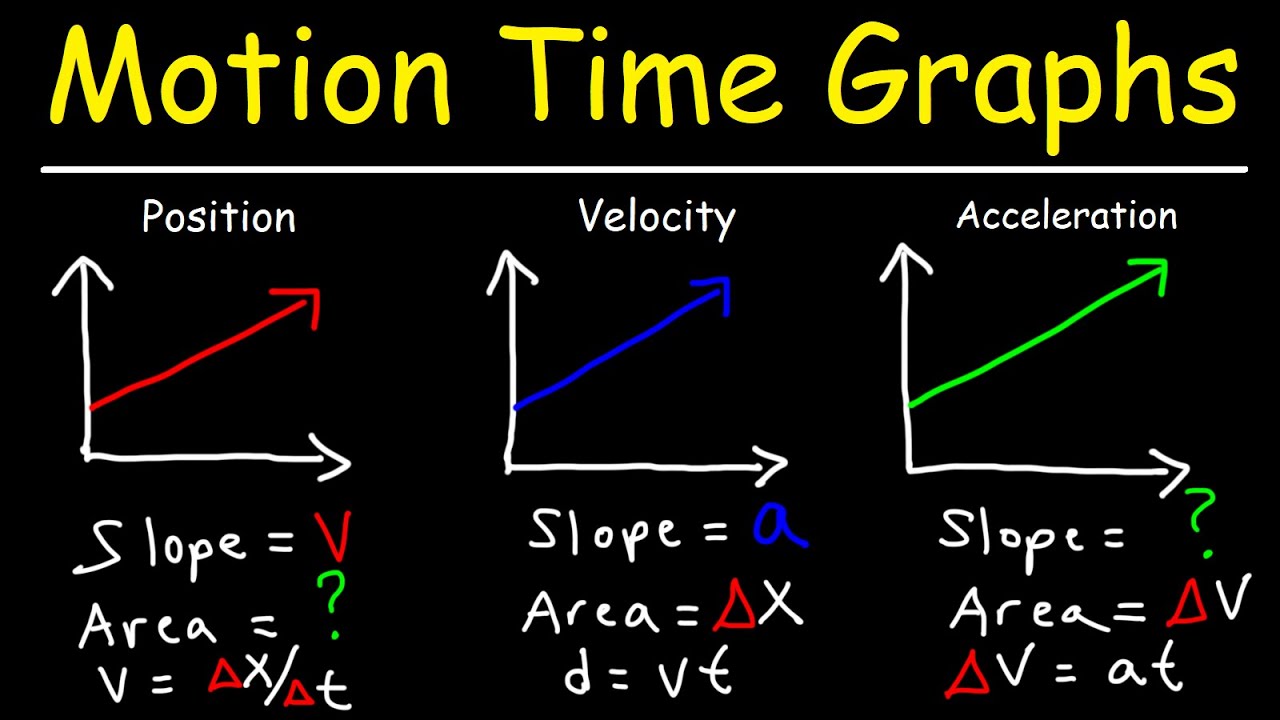
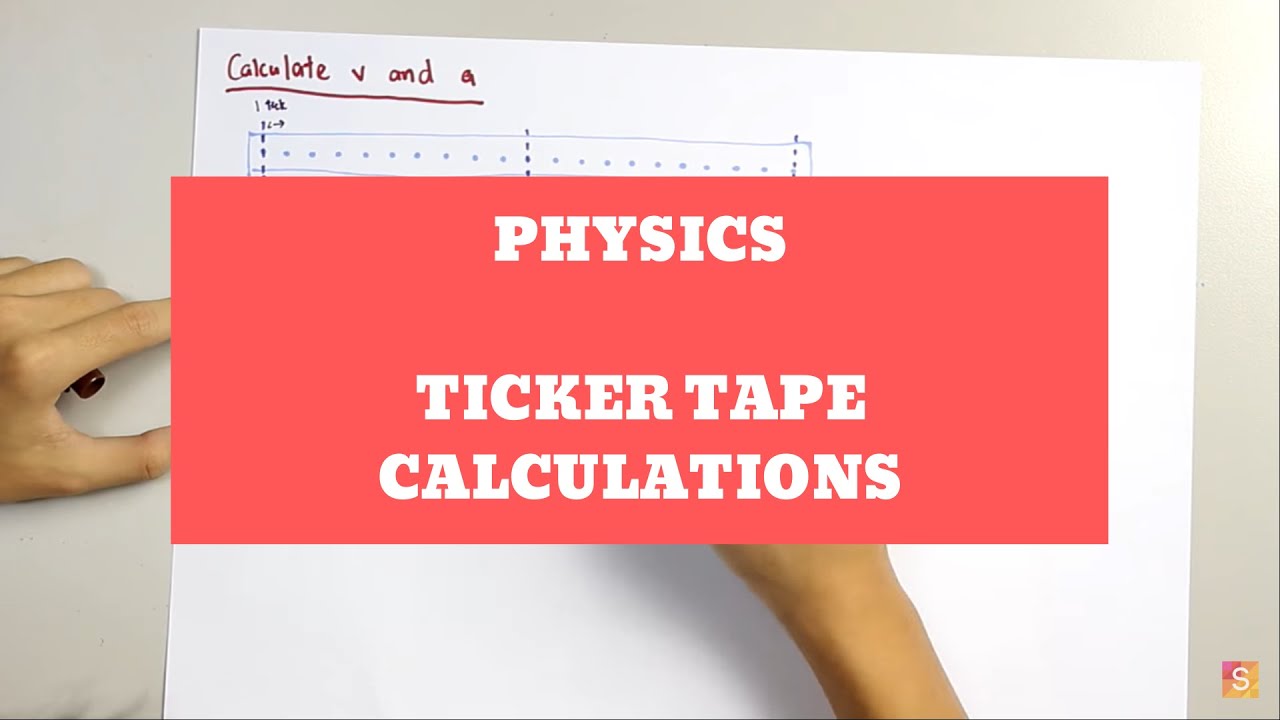
There are lots of ways to analyze motion. One such way is to conduct a ticker tape analysis. This is where a long tape is attached to an object that's moving. That tape is threaded through a device that puts a 'tick' or impression on the tape at regular time intervals (for example, every 0.1 or 0.2 seconds). This leaves a line of dots on the tape, recording the object's motion.
The line of dots on the tape is called a ticker tape diagram. You can measure the distances between the dots to see how far the object traveled during each 0.1 or 0.2 seconds. But you can also figure out the type of motion that occurred at a glance, if you know what to look for.
Повторяем попытку...

Доступные форматы для скачивания:
Скачать видео
-
Информация по загрузке:


![Таймер-тикер — что это такое и как его использовать в эксперименте [PHYSICS ROX ~ MS HOO SHOWS]](https://imager.clipsaver.ru/T1Ub3DOCIL4/max.jpg)