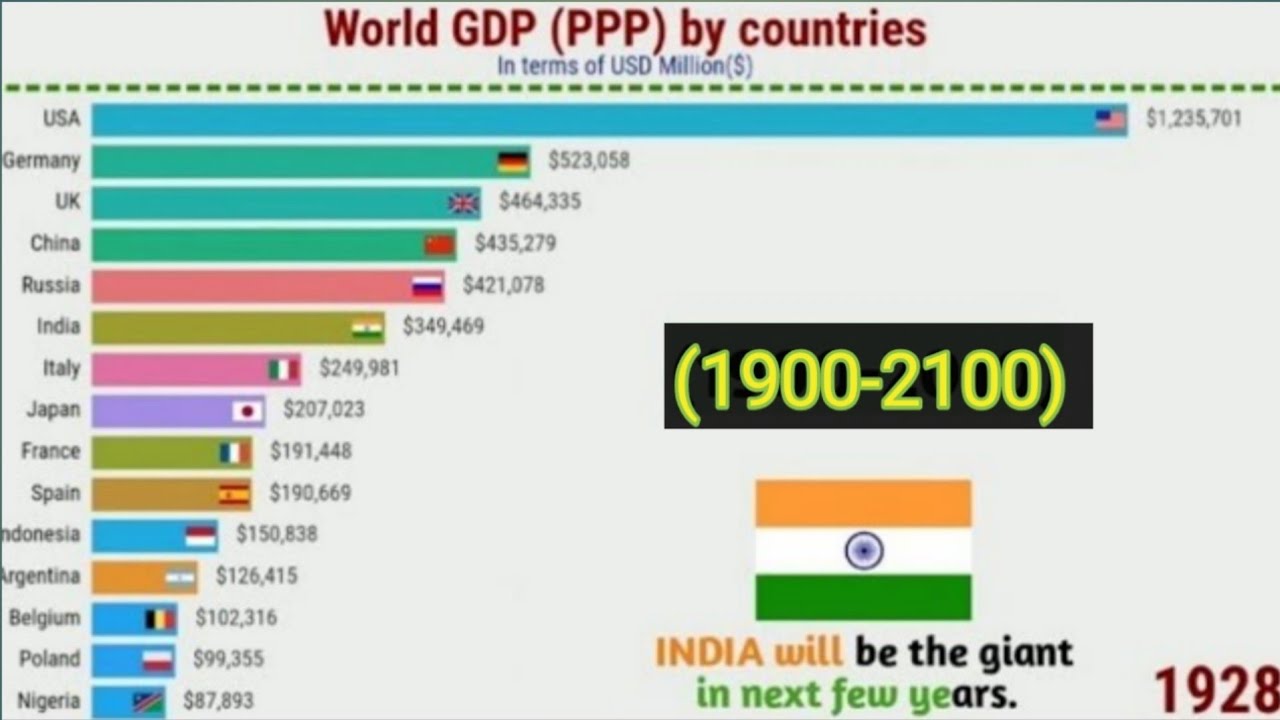
Top 15 Country GDP (PPP) History & Projection (1900-2100)
Автор: MAD TOP 10 {Data is beautiful}
Загружено: 2020-02-15
Просмотров: 1714
Описание:
Hello guys welcome back to MAD TOP 10 channel.
This video shows the top 15 Countries by highest GDP PPP from 1900-2100 based on 2011 International USA dollars.
It gives brief history of world since the 1900
Purchasing power parity (PPP) is measured by finding the values (in USD) of a basket of consumer goods that are present in each country (such as pineapple juice, pencils, etc.). If that basket costs $100 in the US and $200 in the United Kingdom, then the purchasing power parity exchange rate is 1:2.
For example, suppose that Japan has a higher GDP per capita (US$18) than the US (US$16). This means that the average Japanese person makes $2 more than the average American. However, this does not necessarily imply that the Japanese are more affluent. Suppose that one gallon of orange juice costs $6 in Japan, and $2 in the US, i.e. $6 buys a good in Japan that can be purchased in the US for $2. 1 gallon of orange juice is taken as a reference good in this example. Simply, 1 gallon of orange juice can be bought in Japan, versus 3 gallons in America, with an equivalent amount of money. We can calculate a PPP index for Japan vs. the US equal to 1/3. According to orange juice prices, Americans have stronger purchasing power, or are able to buy more value with their money. The US has a PPP-adjusted GDP of $16, which has not changed since it is the reference currency. Japan's GDP, however, is only $6 when adjusted for PPP. This is calculated by multiplying Japan's unadjusted GDP by the PPP index. In reality, a much wider range of goods that includes much more than just orange juice is taken to calculate the PPP index, so that it accurately reflects the average cost of living.
#gdpppp#ppp#iseconomy
Повторяем попытку...
Доступные форматы для скачивания:
Скачать видео
-
Информация по загрузке: