Finding Multiple Melt-Curve Peaks When Using SYBR® Green in Real-Time PCR -- Ask TaqMan®: Ep. 8
Автор: Thermo Fisher Scientific
Загружено: 2012-06-26
Просмотров: 106308
Описание:
Submit your Real-Time PCR questions and watch the rest of our videos at http://ow.ly/bQh0l. Life Technologies Sr. Field Application Specialist Doug Rains helps with the understanding the causes of multiple peaks in a melt curve when using SYBR® Green dye in Real-Time PCR. SYBR® Green I chemistry is a free-floating dye. Here's how it works. When SYBR® Green dye is just swimming around in the tube, it doesn't give off much fluorescence -- even when we zap it with the light source on a real-time PCR machine. But SYBR® Green dye really likes to bind to double-stranded DNA. And, when it does, and you hit it with light, the dye gets excited and fluoresces.
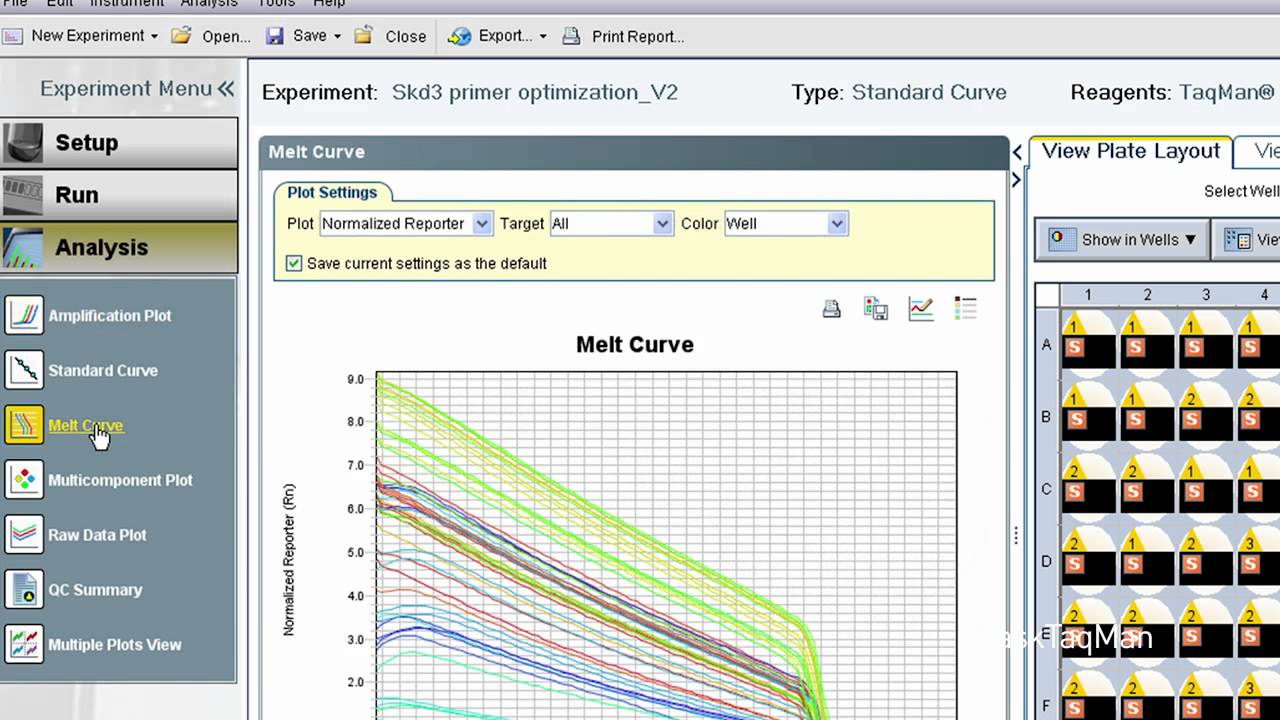
In theory, the basic idea, then, is this: as PCR creates more and more product, the signal of SYBR® Green dye should go up proportionally. In practice, this doesn't always happen. That's because SYBR® Green dye binds to any double-stranded DNA. Meaning, every double-stranded molecule in the tube will bind SYBR® Green dye and add to the fluorescent signal. Because of this concern, users run melt curves after each experiment. They do this by slowly raising the block temperature from about 60 degrees Celsius up to 95 degrees Celsius and monitoring fluorescence. As you can see, signal drops slowly until at some point, it drops off suddenly to zero. Halfway down this drop-off is the presumed melting temperature of the product created during PCR.
If you have the software do a little calculus for you, you get what's called the derivative view, which I find a little more helpful, since the drop-off gets converted into a peak. What you're hoping to see is one, clearly defined peak, which suggests— doesn't prove, mind you— but suggests that you got clean amplification of a single product. One thing you don't want to see is multiple peaks, as this suggests your amplification curves are a composite of more than one product. So what causes extraneous peaks? It really depends. It could be non-specific amplification or primer-dimer formation. In the first case, you'll need to redesign your primers to a more specific sequence. In the latter case, you may just need to lower the concentration of primer to discourage dimer formation, although a primer redesign may ultimately be necessary.
The problem is, it's difficult to know exactly what's causing certain anomalies, so some users end up spending a lot of time repeating failed experiments under multiple new conditions or with multiple new primer sets. That's neither fun nor affordable. Still, SYBR® chemistry is perfectly valid for qPCR when all things go well. Users just need to take more care than users of TaqMan® chemistry do in designing their experiments, and take additional quality control steps when evaluating their data.
Повторяем попытку...
Доступные форматы для скачивания:
Скачать видео
-
Информация по загрузке:


