Скачать
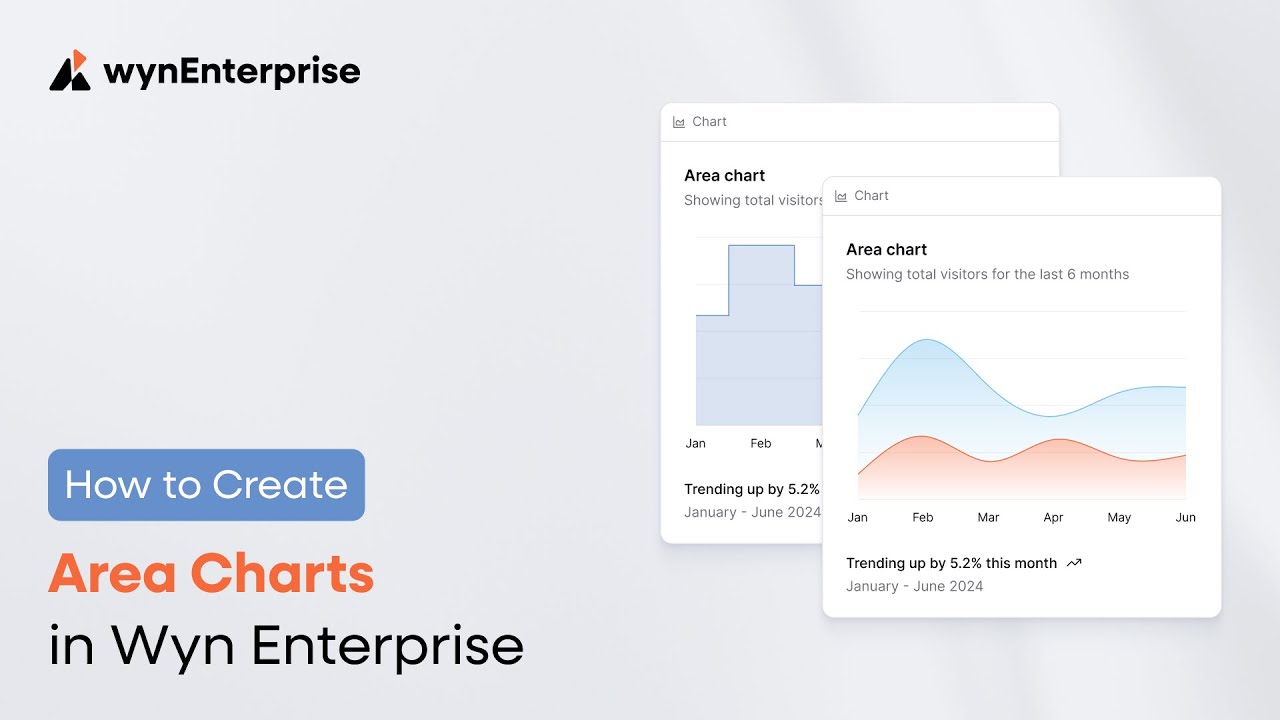
How to Create Area Charts in Wyn Enterprise | Data Visualization
Автор: Wyn Enterprise
Загружено: 2021-05-26
Просмотров: 397
Описание:
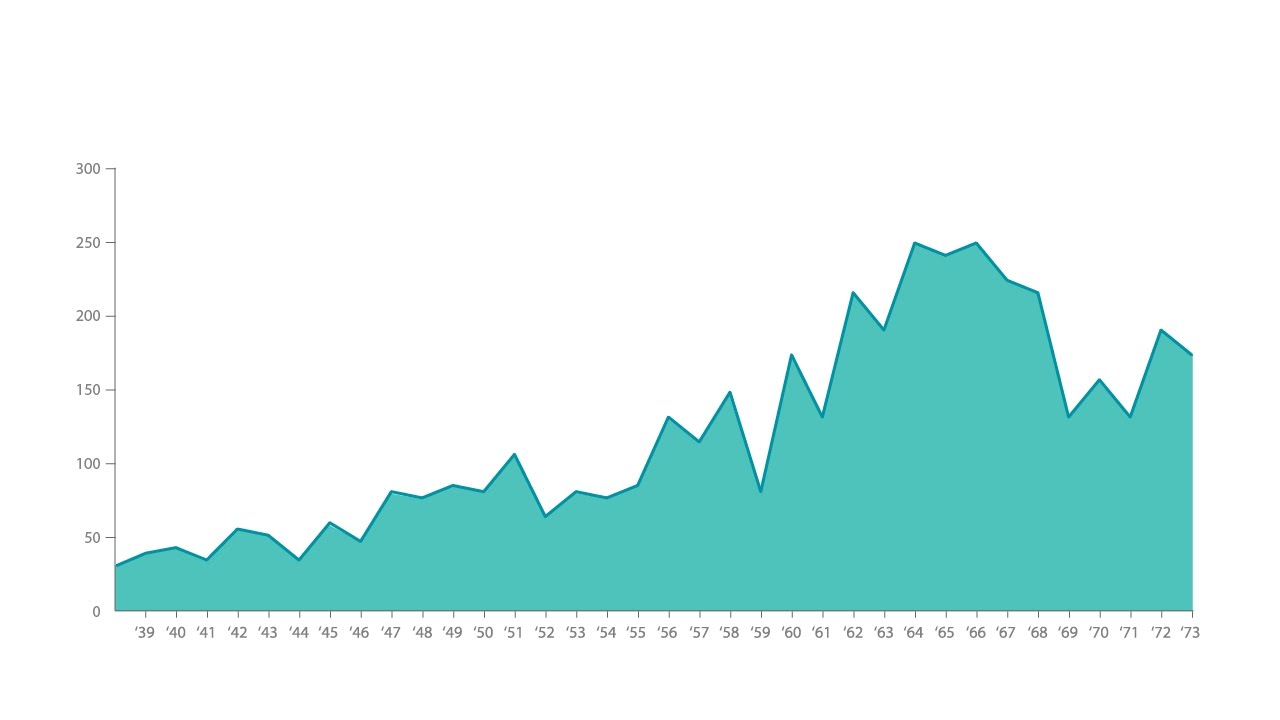
An area chart is a great chart to visualize a volume change over a period of time. It gives a sense of summation of the quantitative data. Here, we'll create four types of area charts with Wyn Enterprise.
Learn more: https://wyn.grapecity.com/blogs/a-gui...
Не удается загрузить Youtube-плеер. Проверьте блокировку Youtube в вашей сети.
Повторяем попытку...
Повторяем попытку...
Доступные форматы для скачивания:
Скачать видео
-
Информация по загрузке: