Скачать
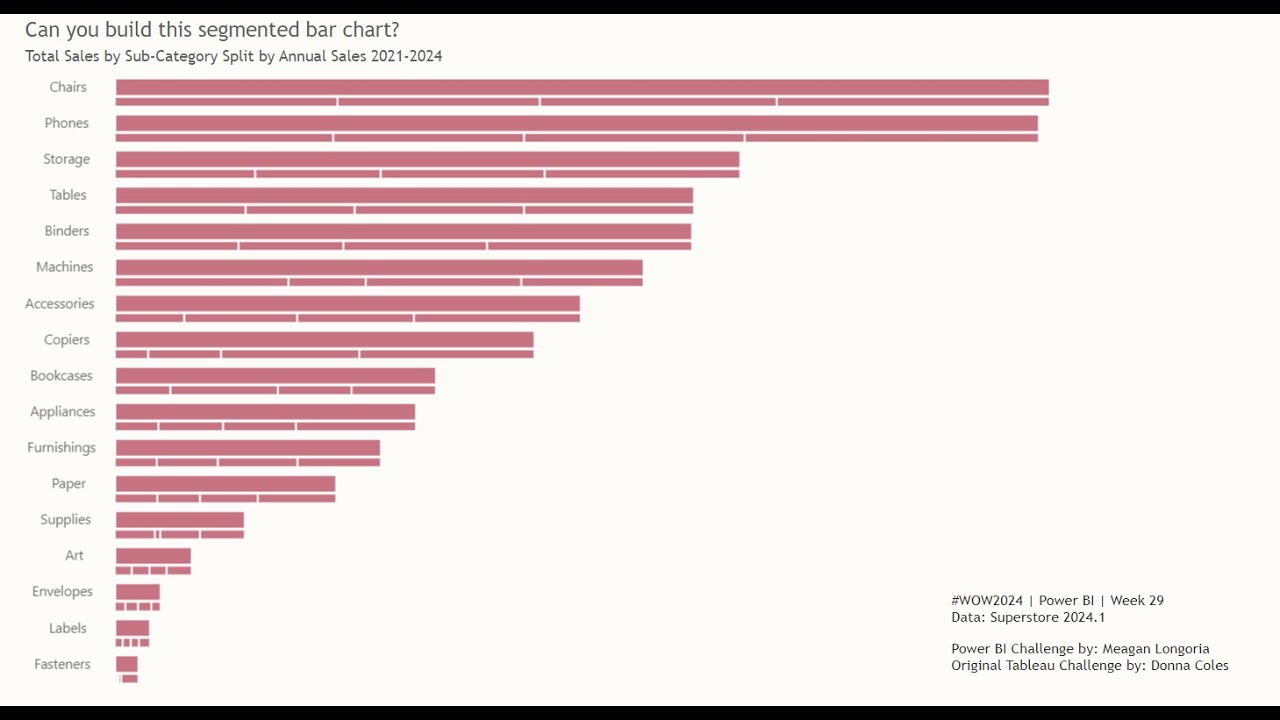
2024 Week 29 | Power BI: Remake of a Tableau Segmented Bar Chart
Автор: Workout Wednesday
Загружено: 2024-07-18
Просмотров: 279
Описание:
This week, we are recreating a previous Tableau workout in Power BI in which we build a segmented bar chart that contains a bar for the total amount followed by a bar that shows a categorical breakdown of that amount.
This challenge involves a bit of data transformation as well as some more advanced data visualization. I used the Deneb custom visual, but you can use whichever visual you would like.
Не удается загрузить Youtube-плеер. Проверьте блокировку Youtube в вашей сети.
Повторяем попытку...
Повторяем попытку...
Доступные форматы для скачивания:
Скачать видео
-
Информация по загрузке: