#tableaututorial
Автор: Modux Tips
Загружено: 2021-01-06
Просмотров: 5153
Описание:
Crear visualizaciones de mapas con múltiples capas con este tutorial. De la mano de Daniel Jiménez, Data Wrangler, te mostrará cómo aprovechar al máximo la esta nueva funcionalidad de Tableau 2020.4.
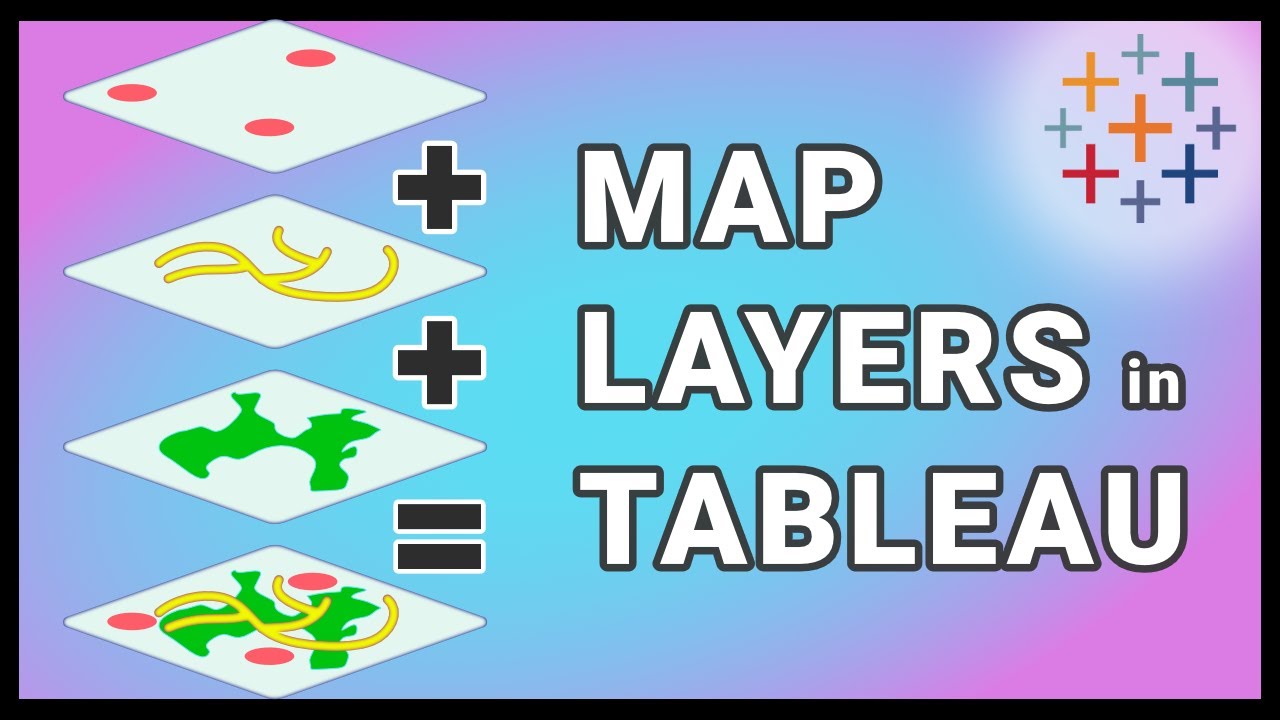
Antes solo podíamos tener dos capas de mapas utilizando un eje doble en Tableau. Sin embargo, con la llegada de Tableau 2020.4, hemos dado un salto en términos de funcionalidad. Ahora puedes agregar y superponer múltiples capas de datos geográficos en un mapa utilizando las capas de Mapas. Estas capas actúan como superposiciones transparentes, cada una con su propio tipo de marca, etiquetas y colores. ¡Ya no hay límites en cuanto a la cantidad de capas que puedes utilizar!
En este video, también exploraremos las funciones MAKEPOINT y MAKELINE, que te permiten crear elementos geográficos de tipo punto y línea, añadiendo aún más profundidad y detalle a tus visualizaciones en Tableau.
No olvides visitar nuestro blog en https://www.modux.co/webinars-tableau/ para acceder a valiosos consejos y revisar nuestros webinars anteriores. Además, asegúrate de suscribirte a nuestro canal de YouTube de ModuxTips en / @modux5190 y darle "Me gusta" a este video. Tu apoyo es fundamental para ayudarnos a llegar a más personas interesadas en Tableau.
Si estás buscando adquirir, implementar o recibir capacitación en la plataforma Tableau, no dudes en contactarnos a través de https://www.modux.co/contactenos/. También puedes encontrarnos en LinkedIn en / modux .
No te pierdas nuestros videos anteriores, llenos de consejos y trucos sobre Tableau:
🔥 Map Drill Down: • Map Drill Down con Tableau
🔥 Reducción del tamaño de archivos Shape: • How to reduce Shape File and its impact in...
🔥 Joins Espaciales de tipo Intersect con Tableau: • Spatial Join with Tableau
🔥 La función AREA en Tableau: • Area Function Tableau 2021.2
🔥 30 Tips de Tableau en 40 minutos: • #tableaututorial 30+ Tips Imperdibles de T...
🔥 30 Tips de Tableau en 50 minutos: • 30 Speed Tips de Tableau en en 50 minutos...
¡Gracias por tu apoyo y esperamos que disfrutes del video! Déjanos tus preguntas y comentarios en la sección correspondiente. ¡Nos vemos en el próximo tutorial de Tableau!
Welcome to Modux Tips! In this exciting Tableau tutorial, Daniel Jiménez, Data Wrangler at Modux, will show you how to make the most of the new functionality in Tableau 2020.4 to create multi-layered map visualizations.
Previously, we were limited to having only two map layers using a dual-axis in Tableau. However, with the arrival of Tableau 2020.4, we have taken a leap in terms of functionality. Now, you can add and overlay multiple layers of geographic data on a map using Map Layers. These layers act as transparent overlays, each with its own mark type, labels, and colors. There are no longer any limits to the number of layers you can use!
In this video, we will also explore the MAKEPOINT and MAKELINE functions, which allow you to create geographic elements such as points and lines, adding even more depth and detail to your visualizations in Tableau.
Don't forget to visit our blog at https://www.modux.co/webinars-tableau/ for valuable tips and to check out our previous webinars. Also, be sure to subscribe to our YouTube channel at / @modux5190 and give this video a thumbs up. Your support is essential in helping us reach more people interested in Tableau.
If you're looking to acquire, implement, or receive training on the Tableau platform, don't hesitate to contact us at https://www.modux.co/contactenos/. You can also find us on LinkedIn at / modux .
Don't miss our previous videos, packed with tips and tricks about Tableau:
🔥 Map Drill Down: • Map Drill Down con Tableau
🔥 Reducing Shapefile Size: • How to reduce Shape File and its impact in...
🔥 Spatial Joins with Intersect in Tableau: • Spatial Join with Tableau
🔥 The AREA function in Tableau: • Area Function Tableau 2021.2
🔥 30 Tableau Tips in 40 minutes: • #tableaututorial 30+ Tips Imperdibles de T...
🔥 30 Tableau Tips in 50 minutes: • 30 Speed Tips de Tableau en en 50 minutos...
Thank you for your support, and we hope you enjoy the video! Feel free to leave your questions and comments in the respective section. See you in the next Tableau tutorial!
Повторяем попытку...

Доступные форматы для скачивания:
Скачать видео
-
Информация по загрузке:
![Tableau Maps [How to Create Stunning Maps in Tableau]](https://imager.clipsaver.ru/MT-HlqUHLFU/max.jpg)