PowerPoint Area Chart - Showcasing Projective Data & Designing the Chart
Автор: Andrew Pach - PowerPoint Training
Загружено: 2024-05-14
Просмотров: 592
Описание:
💾 Project File to Download: https://drive.google.com/file/d/1pCV0...
🎓 Full Course: https://learnfromme.net/powerpoint-ch...
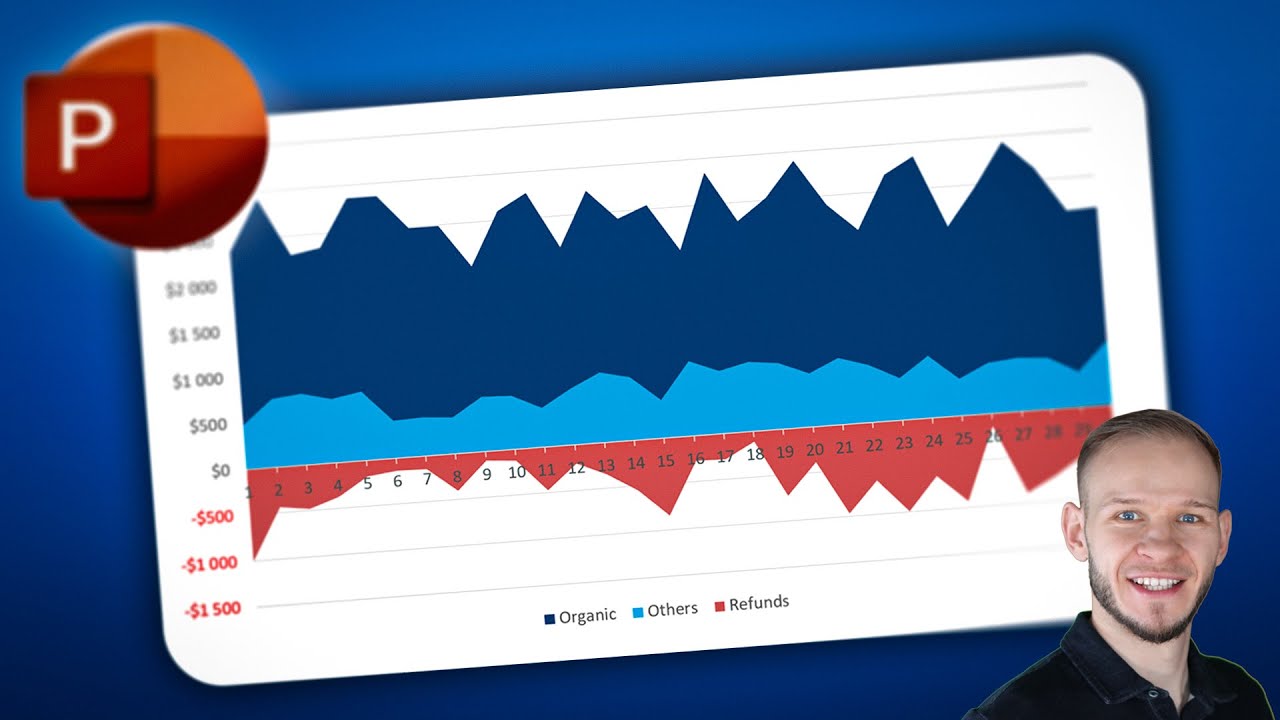
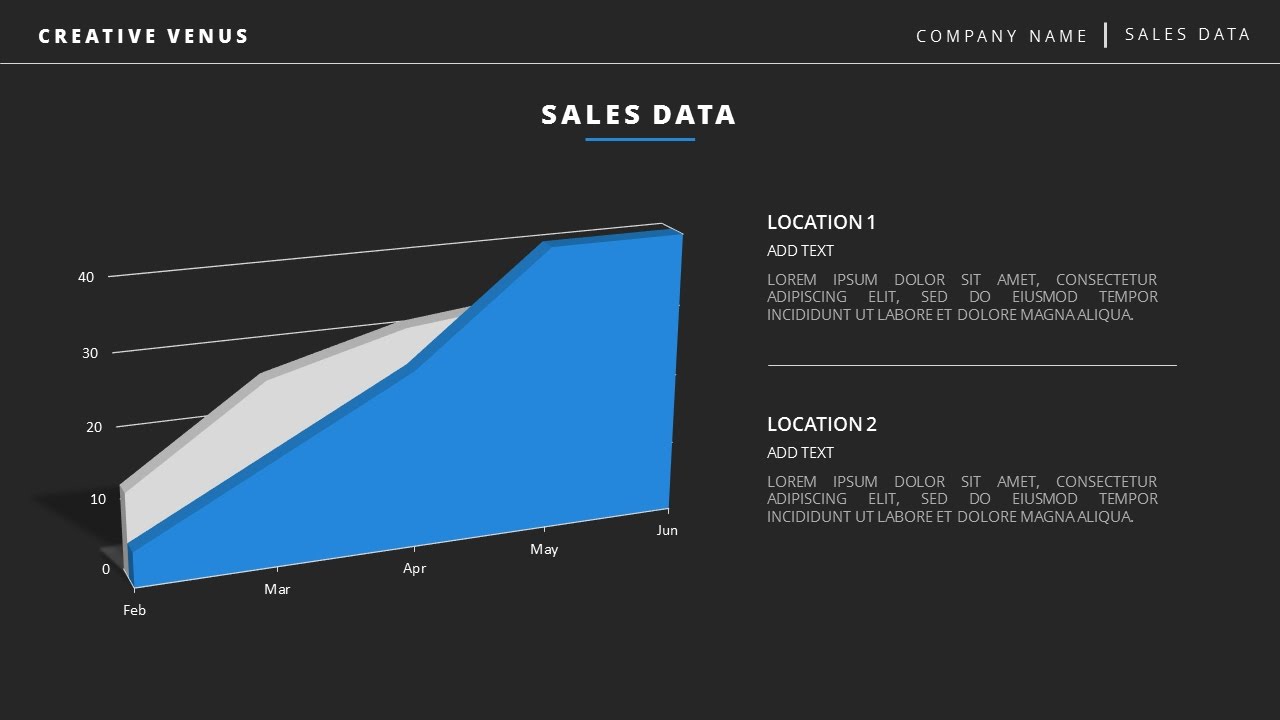
📖 Description: Let me display how to edit and adjust an area chart to display forecast data. We will change the design to a pattern fill to better showcase that this data set is projective and not yet "in effect".
⌚ TIMESTAMPS:
0:00 - Intro
0:38 - Modifying data
2:04 - Selecting Data in PowerPoint
3:09 - Creating Chart
3:35 - Creating Charts on PowerPoint for MAC
4:07 - Coloring the Refunds differently
5:15 - Outro
💻 PPT VERSION: PowerPoint 2021 (Microsoft365 subscription)
📌 SUBSCRIBE : http://www.youtube.com/c/learnfrommen...
🎓 My mission:
I wish to enhance the design quality of presentations, animations and videos on the entire world, video by video. I love creating tutorials, video content and courses on that topic! Come for the title, stay for the humor, learn from the content :)
Повторяем попытку...

Доступные форматы для скачивания:
Скачать видео
-
Информация по загрузке: