Quartile Deviation Explained 2025 | Econometrics
Автор: Economics Learner Lab
Загружено: 2025-03-16
Просмотров: 150
Описание:
Hello All,
In this video, I am going to explain,
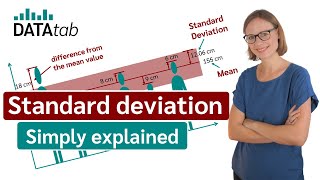
The Quartile deviation, also known as the semi-interquartile range, is a measure of statistical dispersion that shows the spread of the middle 50% of a dataset. It is calculated using the first quartile (Q1) and the third quartile (Q3).
Explanation
~Q1 (First Quartile): The value below which 25% of the data falls.
~Q3 (Third Quartile): The value below which 75% of the data falls.
~Interquartile Range (IQR): The range of the middle 50% of the data, calculated as:
IQR = Q3 - Q1
Quartile Deviation: Measures the spread of the middle 50% of the data, making it less sensitive to extreme values (outliers) than other dispersion measures like the standard deviation.
Don’t forget to LIKE, COMMENT, and SUBSCRIBE for more videos on economics, econometrics, and data analysis! 🚀
#economics
#econometrics
#statistics
#quartiledeviation
#economicslearnerlab
#DrKVenkatesh
Повторяем попытку...

Доступные форматы для скачивания:
Скачать видео
-
Информация по загрузке: