Python Tutorial: How to Visualize Experimental Results
Автор: Marcel Butschle
Загружено: 2024-11-18
Просмотров: 1514
Описание:
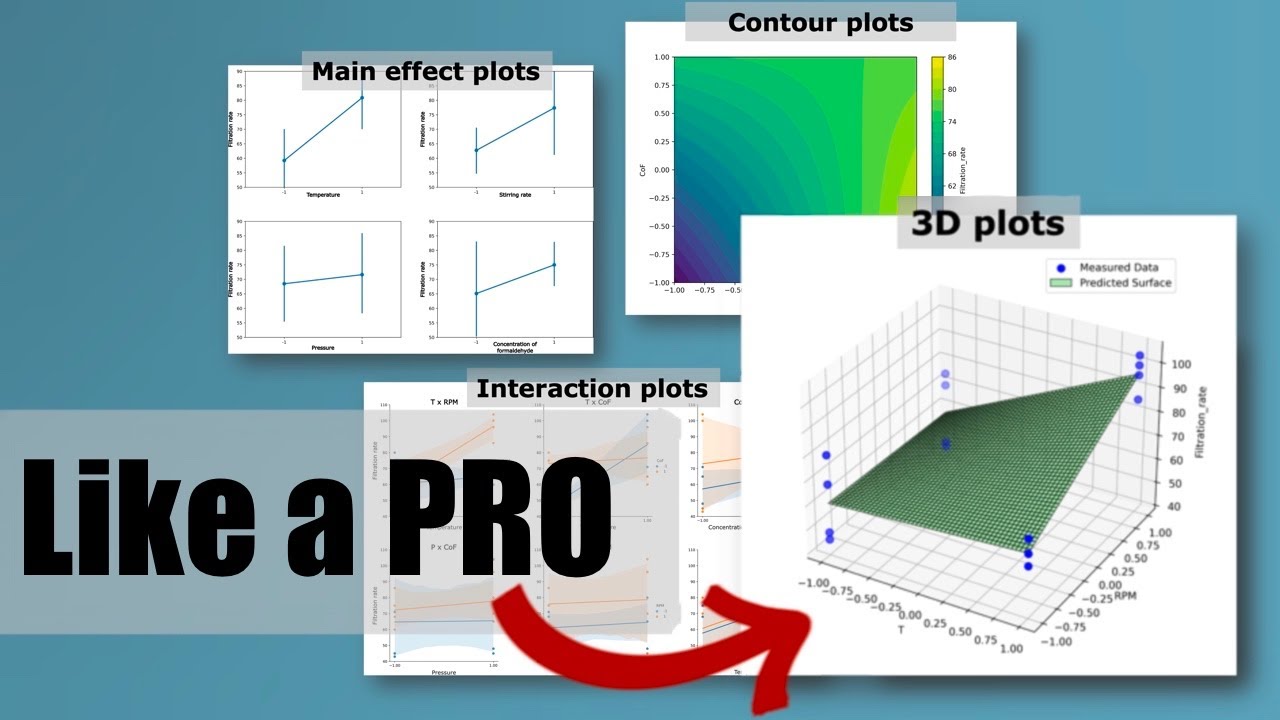
In this video, I’ll show you how to visualize experimental data 📊 using main effects, interaction, contour, and 3D plots in Python. No programming expertise is needed—I’ll handle the coding with help from my AI assistant and you can do the same!
WATCH THIS VIDEO TO LEARN:
Visualize data with main effects, interaction, contour, and 3D plots in Python.
Understand individual and interactive effects of factors on results.
Use seaborn for straightforward, effective visualizations.
Identify optimal conditions with contour and 3D plots.
Build 3D plots to compare predicted and measured data, providing simple model control.
Follow simple, AI-assisted coding steps to apply these techniques.
📂 GET ACCESS TO CODE AND DATA:
https://github.com/MarcelButschle/You...
📖 TAKE A LOOK AT MY BLOG:
https://www.experimentaldesignhub.com
---
CONNECT WITH ME!
💼 LinkedIn: / marcel-butschle
✉️ [email protected]
Повторяем попытку...
Доступные форматы для скачивания:
Скачать видео
-
Информация по загрузке: