Employee Performance & Training Data Analysis - Part 1 Power Bi
Автор: Colorstech Training (By Slidescope)
Загружено: 2025-09-08
Просмотров: 436
Описание:
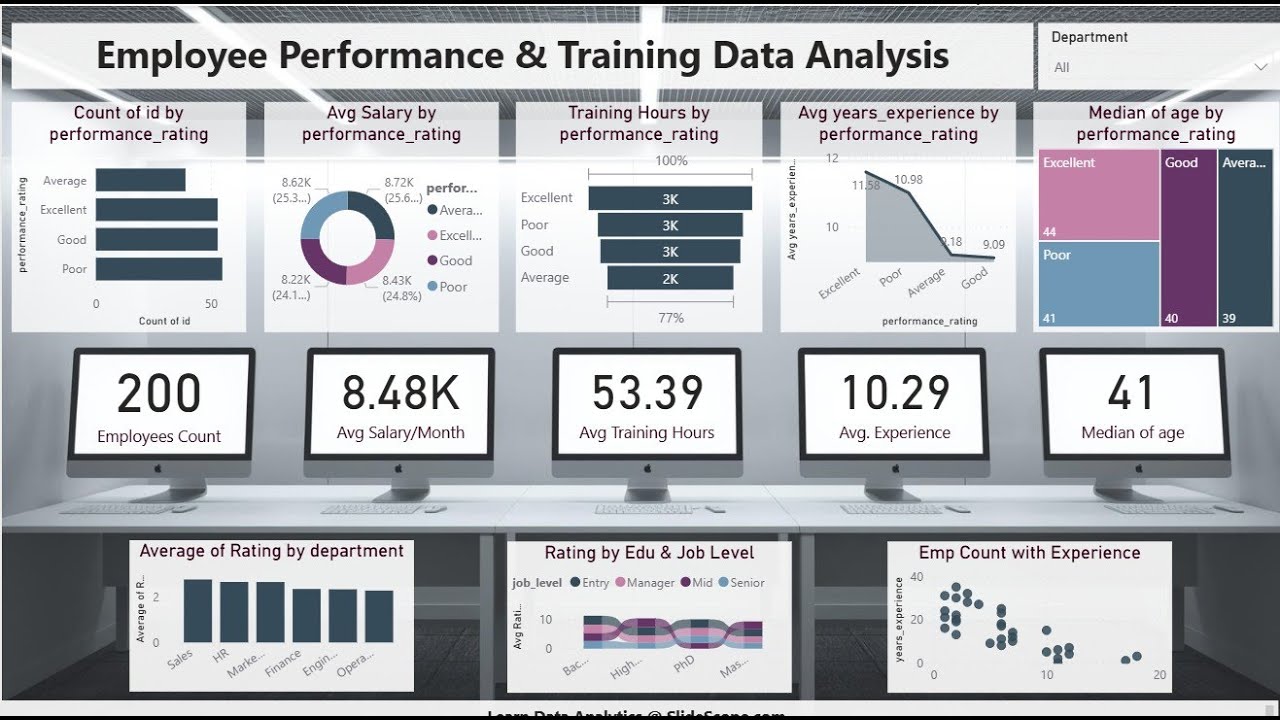
In this video, we present an Employee Performance & Training Data Analysis Dashboard created by Colorstech with SlideScope Institute using Power BI. 🚀
Get the dataset here: https://colorstech.net/power-bi/human...
This interactive dashboard provides a complete overview of employee performance metrics and training insights. It covers:
✅ Employee count and average salary/month
✅ Training hours by performance rating
✅ Average years of experience
✅ Median age distribution
✅ Department-wise performance comparison
✅ Job level and education impact on ratings
✅ Employee experience trends
Whether you are an HR professional, data analyst, or business leader, this dashboard helps you make data-driven decisions for workforce management and training optimization.
👉 Learn Data Analytics with SlideScope Institute and create impactful dashboards like this one.
#powerbi #dataanalytics #employeeperformance #TrainingAnalysis #hranalytics #businessintelligence #dashboarddesign #SlideScope #Colorstech #DataVisualization #WorkforceAnalytics
Повторяем попытку...
Доступные форматы для скачивания:
Скачать видео
-
Информация по загрузке: