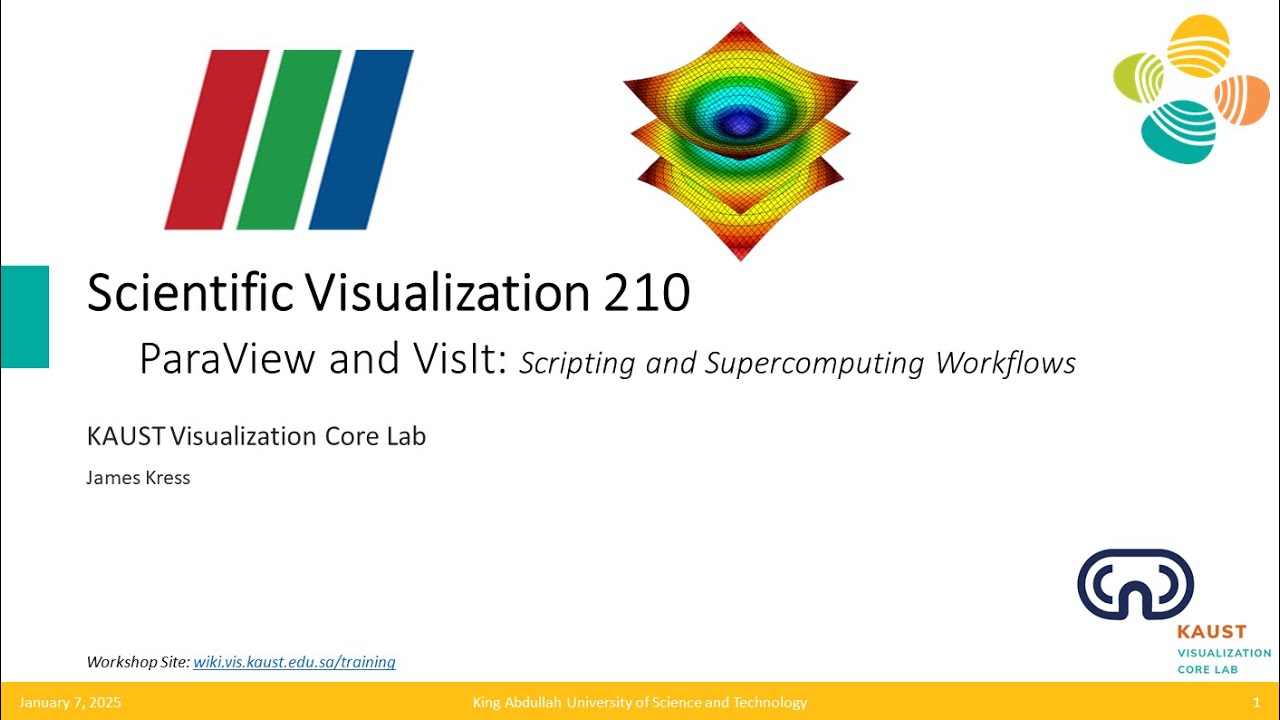
ParaView and VisIt ~ Scripting and Supercomputing Workflows
Автор: KAUST Visualization Core Lab
Загружено: 2025-02-18
Просмотров: 253
Описание:
Overview
Visualization experts from the laboratory will discuss scripting and supercomputing workflows at KAUST using ParaView and VisIt. ParaView and VisIt are highly-scalable, open-source, multi-platform data analysis and visualization applications. ParaView and VisIt users can quickly build visualizations to analyze their data using qualitative and quantitative techniques. The data exploration can be done interactively in 3D. Attendees will participate in a hands-on session working with ParaView and VisIt to create 3D visualizations of scientific datasets.
ParaView and VisIt are essential tools for scientific visualization, especially for large datasets. They are professional-quality, user-friendly software that are packed with advanced functionality. They were developed to analyze extremely large datasets (using distributed memory and parallel computing resources); but, their special super-power is that they grow with the user's data, running great on the laptop, the workstation, the cluster (Ibex), and the supercomputer (Shaheen). Visualization and analytic pipelines created in ParaView and VisIt at the start of your project will continue to work efficiently even as the amount of data produced continues to grow.
Join us to learn how to prepare data, automate visualizations, and scale your analysis from workstation to cluster to supercomputer.
Experts from the Visualization Lab will cover the following advanced topics:
Scalable Visualization Workflows on HPC Systems
Overview of ParaView and VisIt's HPC architecture
Step-by-step ParaView and VisIt visualization workflow for large data
Introduction to ParaView and VisIt client-server batch tools
Programming Visualization Pipelines in Python
Record GUI actions in Python
Visualization Pipelines in Python
Save / Load Vis-Pipelines as Python
interactive — text-based Python console
non-interactive, distributed batch processing
Who Should Attend?
The target audience for this workshop are KAUST and In-Kingdom users who are looking for a new scientific visualization solution and have little or no experience with VisIt or scientific visualization in general.
Agenda
Time Topic
0:00 (Introduction and Setup)
10:06 (Hands-On Session 1: Ibex/Shaheen interactive visualization)
28:01 (Hands-On Session 2: Scripting within ParaView & VisIt)
45:19 (Hands-On Session 3: Scripting visualization from command line)
Workshop files and more info
https://wiki.vis.kaust.edu.sa/trainin...
Previous Related Workshops
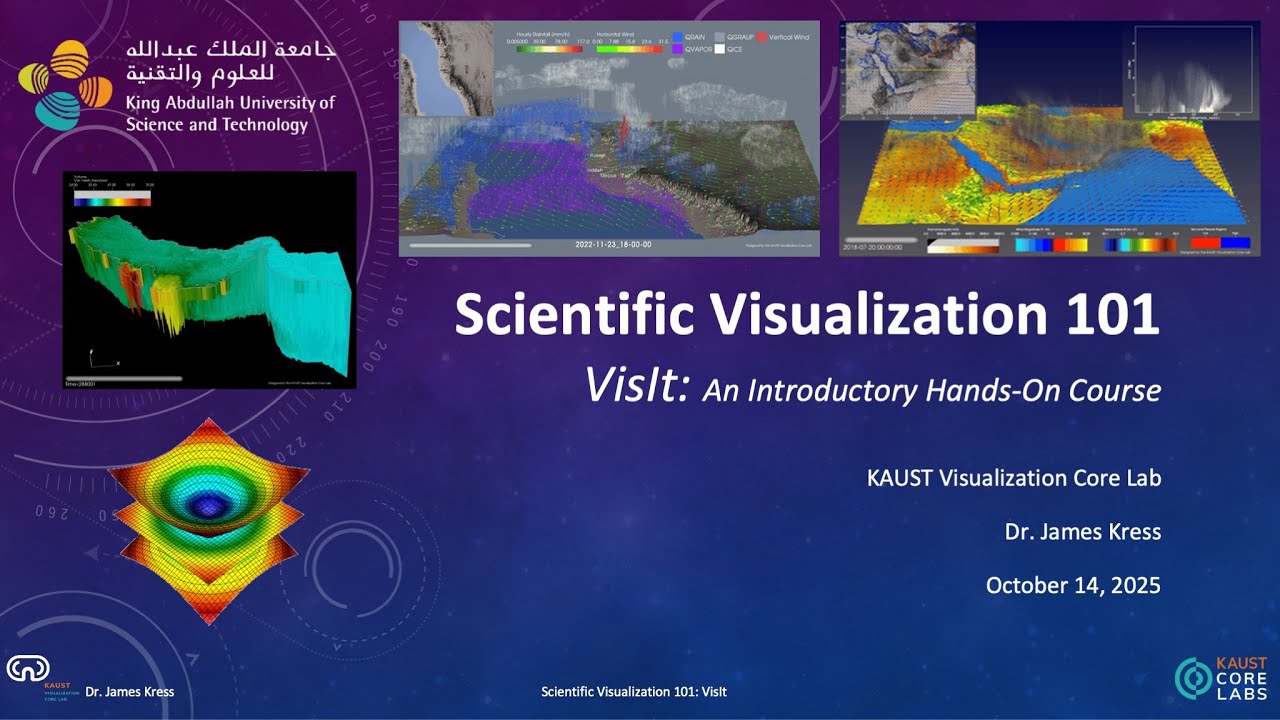
Scientific Visualization 101 ~ VisIt: • Introduction to Scientific Visualization w...
Scientific Visualization 101 ~ ParaView: • Introduction to Scientific Visualization w...
SciVis 210 ~ ParaView and VisIt Supercomputing Workflows: • SciVis 210: ParaView and VisIt Supercomput...
#kaust #visit #scivis #visualization #highperformancecomputing
Повторяем попытку...
Доступные форматы для скачивания:
Скачать видео
-
Информация по загрузке:


![[4K FULL HD] Relaxing Water Background | 1 HOUR | Calm Water Wallpaper (No Sound)](https://imager.clipsaver.ru/y9PTNTSpGJs/max.jpg)