Data Visualise the World
Data is fun, but reading them is hard.
Our channel provides videos of world data ranking visualisations to help us know more about the world from past to present, even to the future!
Mainly Top 10 countries ranking in different areas by bar chart race.
🔴SUBSCRIBE and CLICK the BELL 🔔 and we will continue to upload videos at least twice a week.
https://bit.ly/3e0mHhR😘
😘We hope you enjoyed our videos.😘
💟SOCIAL💟
Facebook Page: https://www.facebook.com/datavisualise
IG: https://www.instagram.com/datavisualise/
Twitter: https://twitter.com/TheVisualise
Blog: https://datavisualiseworld.wordpress.com/
🙏ATTRIBUTION🙏
Bar Chart Race by Flourish: https://flourish.studio/
Data Source: British Geological Survey
Musics: https://incompetech.com/music
📒KEYWORDS📒
data visualise the world, bar chart race, country ranking, data ranking, world data ranking, data, ranking, world, flourish, top 10, top 10 countries
© 2020 🌍Data visualise the World🌏 All rights reserved.
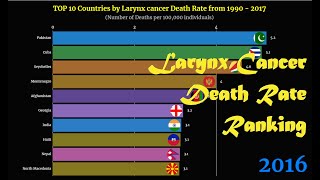
Larynx cancer Death Rate Ranking | TOP 10 Country from 1990 to 2017

Cream Consumption Ranking | TOP 10 Country from 1961 to 2013

Liver Cancer Death Rate Ranking | TOP 10 Country from 1990 to 2017

Barley Consumption Ranking | TOP 10 Country from 1961 to 2013

Stomach Cancer Death Rate Ranking | TOP 10 Country from 1990 to 2017

Poultry Meat Consumption Ranking | TOP 10 Country/Region from 1961 to 2013

Esophageal Cancer Death Rates Ranking | TOP 10 Country from 1990 to 2017

Mutton and Goat Meat Consumption Ranking | TOP 10 Country from 1961 to 2013

RCEP GDP Ranking | TOP 10 Country from 1960 to 2018

Coffee Consumption Ranking | TOP 10 Country from 1961 to 2013

Spirits Consumption Ranking | TOP 10 Country from 1961 to 2014

Pork Consumption Ranking | TOP 10 Country from 1961 to 2013

Tomato Consumption Ranking | TOP 10 Country from 1961 to 2013

Cheese Consumption Ranking | TOP 10 Country from 1961 to 2013

Biliary Tract Cancer Death Rates Ranking | TOP 10 Country from 1990 to 2017

Spices Consumption Ranking | TOP 10 Country from 1961 to 2013

Honey Consumption Ranking | TOP 10 Country from 1961 to 2013

Cocoa Bean Consumption Ranking | TOP 10 Country from 1961 to 2013

Bean Consumption Ranking | TOP 10 Country from 1961 to 2013

Other Pharynx Cancer Death Rates Ranking | TOP 10 Country from 1990 to 2017

Onion Consumption Ranking | TOP 10 Country from 1961 to 2013

Nasopharynx Cancer Death Rates Ranking | TOP 10 Country from 1990 to 2017

Tea Consumption Ranking | TOP 10 Country from 1961 to 2013

Lip and Oral Cavity Cancer Death Rates Ranking | TOP 10 Country from 1990 to 2017

Maize Consumption Ranking | TOP 10 Country from 1961 to 2013

Prostate Cancer Death Rates Ranking | TOP 10 Country from 1990 to 2017

Potato Consumption Ranking | TOP 10 Country from 1961 to 2013

Uterine Cancer Death Rates Ranking | TOP 10 Country from 1990 to 2017

Rice Consumption Ranking | TOP 10 Country from 1961 to 2013

World Cup Teams Ranking by entering Finals from 1930 - 2018