James Norton

Estimate the mean of a grouped data

MEASURING ANGLES

Estimation

Division Bus stop method

Density

Bearings

Area All key formulae for Foundational level

S4 MEAN MEDIAN MODE AND RANGE

PIE CHARTS

S2 tables, diagrams graphs and charts including pie charts, bar charts and tally charts.

S4 MEAN MEDIAN MODE AND RANGE

SIGNIFICANT FIGURES GCSE

Compound Interest

R12 Scale Factors

R11 Speed Distance Time

R9 PERCENTAGES

R8 Ratios to Fractions

R7 RATIOS AND RECIPES

R5 SHARING IN A RATIO

R3 Simplifying ratios

R2 use scale factors, scale diagrams and maps

R1 change freely between related standard units

P8 Probability Tree Diagrams

P7 Two way tables

P6 Venn Diagrams

P1 Frequency Trees

P2 Probability and Expected outcomes
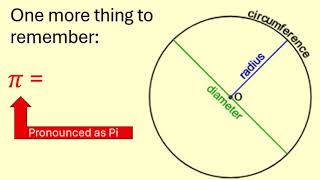
G17 Circles Area and Circumference

G16 Volume

G14 Standard units of measure