Polo Club of Data Science @ Georgia Tech
At Georgia Tech, our research group innovates at the intersection of data mining and human-computer interaction (HCI) to synthesize scalable, interactive, and interpretable tools that amplify human’s ability to understand and interact with billion-scale data and machine learning models. Our focus application areas include cybersecurity (e.g., fraud detection, malware detection), adversarial machine learning (how to protect and break AI and deep learning), health, energy and social good.
This YouTube Channel present video highlights of research from our group. For more details about our research project, visit our homepage at http://poloclub.gatech.edu

How to Fix PNG Export Issues in Figma
![[Demo Video] Transformer Explainer: Learning LLM Transformers with Interactive Visual Explanation](https://ricktube.ru/thumbnail/TFUc41G2ikY/mqdefault.jpg)
[Demo Video] Transformer Explainer: Learning LLM Transformers with Interactive Visual Explanation
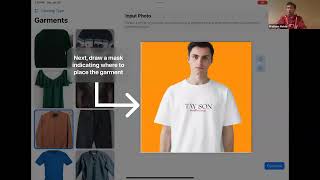
Mobile Fitting Room - CVPR 2024 Workshop on Virtual Try-On

ARCollab: Mobile Augmented Reality for Cardiovascular SurgicalPlanning

Demo Video "LLM Attributor: Interactive Visual Attribution for LLM Generation"

Transformers Explained Visually: Learn How LLM Transformer Models Work

How to Select Objects with Same Color in Figma | Figma How-To

Robust Principles: Architectural Design Principles for Adversarially Robust CNNs

Revamp: Automated Simulations of Adversarial Attacks on Arbitrary Objects in Realistic Scenes

Random Forest Machine Learning Algorithm Explained

VisGrader: Automatic Grading of D3 Visualizations

Stable Diffusion Explained with Examples — Visualizing Text-to-Image Generation

Literature Review Made Easy with Visualization: Argo Scholar Tutorial with Captions

VIS'22 Argo Scholar Evaluation Teaser

Visual Auditor: Interactive Visualization for Detection and Summarization of Model Biases

Demo Video "Dodrio: Exploring Transformer Models with Interactive Visualization"

How to add text box to Tableau dashboard | Tableau How-To

HILDA 2022 Keynote: Visualization for Deep Learning: An Odyssey

DetectorDetective

Demo Video "VisCUIT: Visual Auditor for Bias in CNN Image Classifier"

NeuroCartography: Scalable Automatic Visual Summarization of Concepts in Deep Neural Networks

Best of Both Worlds: Robust Accented Speech Recognition with Adversarial Transfer Learning

Towards Automatic Grading of D3.js Visualizations

Argo Scholar: Interactive Visual Exploration of Literature in Browsers

Demo Video "Dodrio: Exploring Transformer Models with Interactive Visualization"

Interactive Scalable Visualizations for Data Discoveries and Interpretable AI

Study and Work in USA for International Students

CardiacAR: Interactive Cardiovascular Surgical Planning via Augmented Reality

LinkedIn Data Science: Creating Global Economic Opportunities

SkeletonVis - Visualization for Understanding Adversarial Attacks on Human Action Recognition Models